GCP 検証用GKEクラスタを作成する(K8s v1.25)
Kubernetes(K8s)の検証をしたいけど自分でK8sクラスタを立てるのは面倒、、、というときは、パブリッククラウドのKubernetesサービスを使うと便利。
中でもGoogle Cloud Platform(GCP)のKubernetesサービスであるGoogle Kubernetes Engine(GKE)はクラスタ作成にかかる時間が短く、無料枠も充実しているのでよく使っている。
検証用のGKEクラスタを準備した際のメモを残しておく。
※無料枠について(2022年10月時点)
- GCPは、アカウントごとに1回だけ、無料プログラムとして90 日間有効な300ドル分のクレジットを提供してくれる。
- GKEは、クラスタが存在するだけで1時間1クラスタあたり0.10ドルのクラスタ管理手数料がかかる。
しかし、GKEの無料枠として1クラスタ分のクラスタ管理手数料相当のクレジット(月額74.40ドル)が毎月提供されるので、1クラスタまではクラスタ管理手数料が実質無料になっている(上記の無料プログラムとは別)。
標準クラスタを使用する場合は、クラスタ管理手数料以外にワーカーノードのGoogle Compute Engine(GCE)のコストがかかるが、無料プログラムと併用したり、使わないときはインスタンスを停止するなどすればかなり節約できる。
環境
- GKE:v1.25.1-gke.500
実施内容
作成するGKEクラスタの運用モードを検討
GKEクラスタのタイプの説明を読んで、作成するGKEクラスタの運用モードを検討する。
運用モードには以下の2種類がある。
→AutoPilotの方が楽そうだが、GCPに管理を任せる範囲が広い分、Autopilotならではの制約もある。
検証・勉強用途なので、制約の少ないStandardモードにする。
GKEクラスタを作成する
GCPの以下ドキュメントを参考に、GKEクラスタを作成してみる。
cloud.google.com
GCPのナビゲーションメニュー(画面左上)から、「Kubernetes Engine」をクリックする。
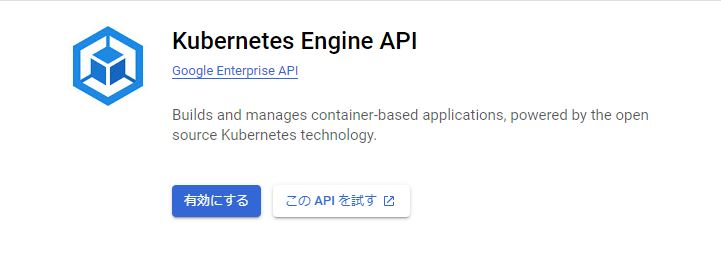
GKEを初めて使う場合は、以下のようにKubernetes Engine APIの有効化画面が表示されるので、「有効にする」をクリックする。
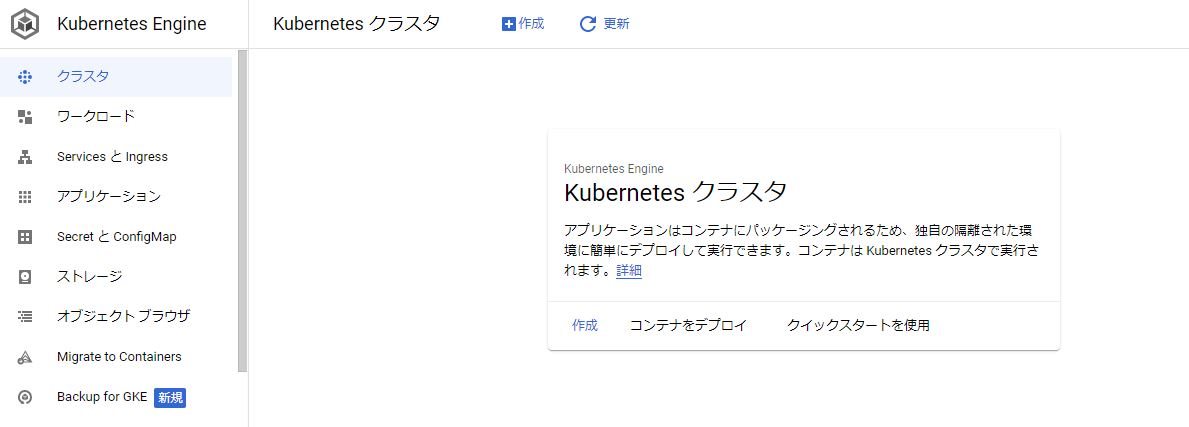
しばらく待つと以下の画面になるので「作成」をクリックする。
次は運用モードの選択。Standardの「構成」をクリックする。

クラスター名とロケーションタイプを入力する。
ロケーションタイプはデフォルトの「ゾーン」にした。
使用するゾーンはどこでもよいが、自分はGCEの無料枠でオレゴンリージョン(us-west1)に作成したVMインスタンスからGKEに接続する予定のため、オレゴンリージョンのゾーンにした。

コントロールプレーンのバージョンを選択する。
今回は出来るだけ新しいバージョンのK8sを使いたかったので、Rapidチャンネルの最新バージョンを選択した。

最後に画面下部の「作成」をクリックする。
※他にもワーカーノードのインスタンスタイプやクラスタのネットワークなど、色々設定ができるが、そこは特に触らずデフォルトのまま作成した。
しばらく待つと、以下のようにGKEクラスタが作成される。

クラスタを選択して「ノード」タブを見ると、e2-mediumのGCEインスタンス3台がワーカーノードとしてクラスタに参加していることが分かる。

Cloud ShellからGKEクラスタに接続する
クラスタができたので、kubectlで操作してみる。
とりあえず、こちらのページを参考に、Cloud Shellでクラスタに接続する。
GCPの管理コンソール右上の、「Cloud Shell をアクティブにする」をクリックしてCloud Shellを起動し、以下を実行する。
デフォルトのプロジェクトを設定
$ gcloud config set project {GKEクラスタを作成したプロジェクトのID}

クラスタ名とクラスタが存在するゾーンを指定して、クラスタ認証情報を取得
$ gcloud container clusters get-credentials cluster-1 --region us-west1-a

kubectlが実行できるようになったことを確認
$ kubectl get node
NAME                                       STATUS   ROLES    AGE   VERSION
gke-cluster-1-default-pool-71e862dd-7b78   Ready    <none>   69m   v1.25.1-gke.500
gke-cluster-1-default-pool-71e862dd-lbk8   Ready    <none>   69m   v1.25.1-gke.500
gke-cluster-1-default-pool-71e862dd-rh0q   Ready    <none>   69m   v1.25.1-gke.500
GKEクラスタの動作確認をする
kubectlを実行できるようになったので、こちらを参考にサンプルAPを使った動作確認をする。
そのままの手順だとServiceがインターネットに公開されてしまうので、Serviceのyaml内の loadBalancerSourceRangesに自分の端末が使っているグローバルIPを指定してソースIP制限している。
サンプルDeploymentのyamlを作成
$ cat <<EOF > hello-server-deployment.yaml
apiVersion: apps/v1
kind: Deployment
metadata:
  name: hello-server
  labels:
    app: hello
spec:
  selector:
    matchLabels:
      app: hello
  template:
    metadata:
      labels:
        app: hello
    spec:
      containers:
      - name: hello-app
        image: us-docker.pkg.dev/google-samples/containers/gke/hello-app:1.0
        ports:
        - containerPort: 8080
EOF

サンプルDeploymentを作成
$ kubectl apply -f hello-server-deployment.yaml
deployment.apps/hello-server created

正常に作成されたことを確認
$ kubectl get deployment
NAME           READY   UP-TO-DATE   AVAILABLE   AGE
hello-server   1/1     1            1           27s
$ kubectl get pod
NAME                            READY   STATUS    RESTARTS   AGE
hello-server-6cfcb8c7df-8bb2z   1/1     Running   0          31s

サンプルServiceのyamlを作成
$ cat <<EOF > hello-server-service.yaml
apiVersion: v1
kind: Service
metadata:
  name: hello-server
  labels:
    app: hello
spec:
  selector:
    app: hello
  ports:
  - port: 80
    targetPort: 8080
  type: LoadBalancer
  loadBalancerSourceRanges:
  - {自分の端末のグローバルIPを記載}/32
EOF

サンプルServiceを作成
$ kubectl apply -f hello-server-service.yaml
service/hello-server created

EXTERNAL-IPがPENDINGからIPの表示に変わるのを待つ
$ kubectl get service hello-server -w
NAME           TYPE           CLUSTER-IP    EXTERNAL-IP   PORT(S)        AGE
hello-server   LoadBalancer   10.96.4.233   <pending>     80:30722/TCP   17s
hello-server   LoadBalancer   10.96.4.233   34.105.117.184   80:30722/TCP   36s
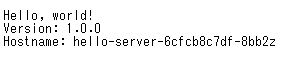
ブラウザで「http://EXTERNAL_IP」にアクセスする。
以下のように表示されれば、正常にサンプルアプリを外部公開できている。
確認できたら、動作確認用に作成したリソースを削除する。
$ kubectl delete -f hello-server-service.yaml
service "hello-server" deleted

$ kubectl delete -f hello-server-deployment.yaml
deployment.apps "hello-server" deleted
GCEのVMインスタンス(CentOS7)からGKEクラスタに接続する
諸事情で、Cloud ShellじゃなくGCEのVMインスタンスからkubectlでクラスタを操作したいので、接続を試してみる。
VMインスタンスは以下記事で作成したものを使用する。
tk-ch.hatenablog.com
「kubectl をインストールしてクラスタ アクセスを構成する」を参考に設定を進める。
kubectlをインストールする
gcloudコマンドでインストール
$ gcloud components install kubectl

kubectlのバージョンを確認
$ kubectl version
Client Version: version.Info{Major:"1", Minor:"22+", GitVersion:"v1.22.14-dispatcher-dirty", GitCommit:"009f3ac5f1d09b1ec5d4dc811b6032271fe61f75", GitTreeState:"dirty", BuildDate:"2022-09-19T01:31:36Z", GoVersion:"go1.16.15", Compiler:"gc", Platform:"linux/amd64"}
The connection to the server localhost:8080 was refused - did you specify the right host or port?
こちらに以下の記載がある。
Kubernetes バージョン 1.26 がリリースされる前に gcloud CLI を起動する場合は、gke-gcloud-auth-plugin バイナリのインストールが必要になります。インストールされていない場合は、kubectl などのカスタム Kubernetes クライアントの既存のインストールは機能しなくなります。 kubectl などのクライアントで GKE を操作するには、このプラグインをインストールする必要があります。
作業時点で1.26はリリースされていないので、gke-gcloud-auth-pluginが必要。
確認したところ、kubectlと一緒にインストールされていた。
$ gke-gcloud-auth-plugin --version
Kubernetes v1.25.2-alpha+ae91c1fc0c443c464a4c878ffa2a4544483c6d1f
kubectlにGKEクラスタの情報を設定する。
クラスタ名とクラスタが存在するゾーンを指定して、クラスタ認証情報を取得する
$ gcloud container clusters get-credentials cluster-1 --region us-west1-a
Fetching cluster endpoint and auth data.
kubeconfig entry generated for cluster-1.
※「gcloud container clusters get-credentials」実行時に、以下のエラーになった場合
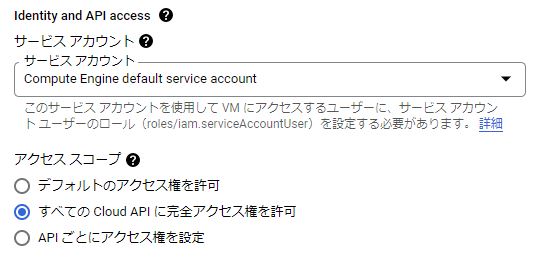
クラスタ名とクラスタが存在するゾーンを指定して、クラスタ認証情報を取得する
$ gcloud container clusters get-credentials cluster-1 --region us-west1-a
Fetching cluster endpoint and auth data.
ERROR: (gcloud.container.clusters.get-credentials) ResponseError: code=403, message=Request had insufficient authentication scopes.

If you are in a compute engine VM, it is likely that the specified scopes during VM creation are not enough to run this command.
See https://cloud.google.com/compute/docs/access/service-accounts#accesscopesiam for more information about access scopes.
See https://cloud.google.com/compute/docs/access/create-enable-service-accounts-for-instances#changeserviceaccountandscopes for how to update access scopes of the VM.
→こちらによると、認証スコープが足りていない。
インスタンスの設定を確認すると、「デフォルトのアクセス権を許可」になっていたので、以下のように「すべての Cloud API に完全アクセス権を許可」に変更して対処した(設定変更時はインスタンスを停止する必要がある)。
kubectlでGKEクラスタに接続する。
クラスタに接続出来ているが、WARNINGメッセージが出る
$ kubectl get node
W1016 13:50:03.312107   20207 gcp.go:119] WARNING: the gcp auth plugin is deprecated in v1.22+, unavailable in v1.26+; use gcloud instead.
To learn more, consult https://cloud.google.com/blog/products/containers-kubernetes/kubectl-auth-changes-in-gke
NAME                                       STATUS   ROLES    AGE   VERSION
gke-cluster-1-default-pool-71e862dd-7b78   Ready    <none>   3d    v1.25.1-gke.500
gke-cluster-1-default-pool-71e862dd-lbk8   Ready    <none>   3d    v1.25.1-gke.500
gke-cluster-1-default-pool-71e862dd-rh0q   Ready    <none>   3d    v1.25.1-gke.500
WARNINGメッセージで案内された「Here's what to know about changes to kubectl authentication coming in GKE v1.26」を見ると、kubectl がgke-gcloud-auth-pluginを使うようにするためには、設定が必要とのこと。
記載されている手順を実行してみる。
環境変数を~/.bashrcに記載
$ echo "export USE_GKE_GCLOUD_AUTH_PLUGIN=True" >> ~/.bashrc

変更を反映
$ source ~/.bashrc

gcloudのコンポーネントを最新版に更新
$ gcloud components update

再度クラスタの認証情報を取得
$ gcloud container clusters get-credentials cluster-1 --region us-west1-a
Fetching cluster endpoint and auth data.
kubeconfig entry generated for cluster-1.

WARNINGが出なくなった
$ kubectl get node
NAME                                       STATUS   ROLES    AGE   VERSION
gke-cluster-1-default-pool-71e862dd-7b78   Ready    <none>   3d    v1.25.1-gke.500
gke-cluster-1-default-pool-71e862dd-lbk8   Ready    <none>   3d    v1.25.1-gke.500
gke-cluster-1-default-pool-71e862dd-rh0q   Ready    <none>   3d    v1.25.1-gke.500
kubectlの自動補完とエイリアスの設定をする。
$ sudo yum install -y bash-completion
$ source <(kubectl completion bash)
$ echo "source <(kubectl completion bash)" >> ~/.bashrc
$ echo 'alias k=kubectl' >> ~/.bashrc
$ echo 'complete -F __start_kubectl k' >> ~/.bashrc
$ exit
もう一度ログインすると、kubectlでもkでもtabでのコマンド補完が有効になっている。
$ kubectl
alpha          autoscale      create         exec           logs           rollout        version
annotate       certificate    debug          explain        options        run            wait
api-resources  cluster-info   delete         expose         patch          scale
api-versions   completion     describe       get            plugin         set
apply          config         diff           help           port-forward   taint
attach         cordon         drain          kustomize      proxy          top
auth           cp             edit           label          replace        uncordon

$ k
alpha          autoscale      create         exec           logs           rollout        version
annotate       certificate    debug          explain        options        run            wait
api-resources  cluster-info   delete         expose         patch          scale
api-versions   completion     describe       get            plugin         set
apply          config         diff           help           port-forward   taint
attach         cordon         drain          kustomize      proxy          top
auth           cp             edit           label          replace        uncordon
まとめ
GCP Compute Engine インスタンス(無料枠)を作成してSSH接続する
Google Cloud Platform(GCP)のIaaSサービスであるGoogle Compute Engine(GCE)に検証用途でVMインスタンスを作成し、SSH接続をしたときのメモ。
環境
実施内容
インスタンスを作成する
GCPのドキュメントを参考に、VMインスタンスを作成する。
GCEの無料枠に収まるよう、以下の内容で作成することにした。
※リージョンはアイオワ(us-central1)、サウスカロライナ(us-east1)も対象だが、東京からの距離が最も近いオレゴンを選択した。
GCEのページで「インスタンスを作成」をクリックする。
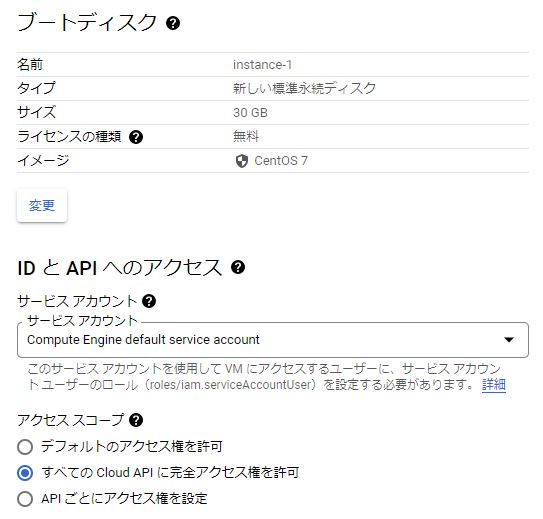
作成するインスタンスの設定画面になるので、上記の無料枠条件に当てはまるよう、以下のようにリージョン、ゾーン、マシンの構成、ブートディスク、アクセススコープの設定を変更する。
- 今回はCentOS7を使いたいので、ブートディスクのイメージのところは「CentOS7」を選択する。
- アクセススコープは「デフォルトのアクセス権を許可」だと実行出来ない操作が出てくるので、色々検証できるよう「すべての Cloud API に完全アクセス権を許可」に変更する。

設定を変更したら、画面一番下の「作成」をクリックする。
すると、以下のようにVMインスタンスが作成される。
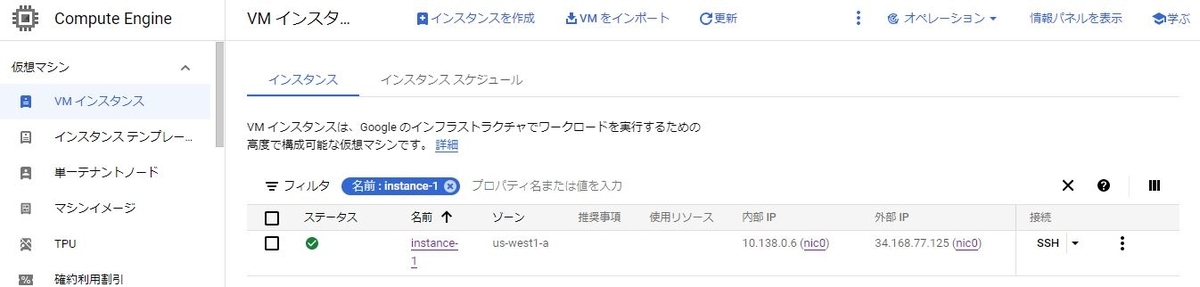
インスタンスの外部IPを固定する
インスタンスには外部IP(グローバルIP)が割り当てられているが、これはエフェメラル外部IPで、インスタンスの再起動などで変わってしまう。
固定の方が使うときに便利なので、こちらを参考に外部IPをエフェメラルから静的IPに昇格させる。
ナブゲーションメニューからVPCネットワークの画面に遷移し、「IPアドレス」をクリックする。
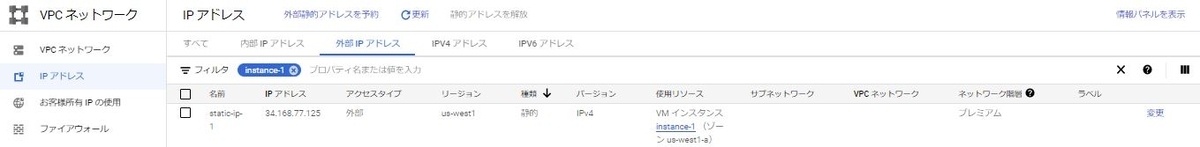
以下のようにIPアドレスの一覧が表示される。
先ほど作成したinstance-1に割り当てられた外部IPがあるので、一番右の「予約」をクリックする。

静的IPアドレス名を適当に付けて「予約」をクリックする。

すると、以下のようにIPの種類列の表示が「エフェメラル」から「静的」に変わる。
これで外部IPを固定化できた。
インスタンスのファイアウォール設定
インスタンスの一覧のIP列にある「nic0」をクリックすると、ネットワーク インターフェースの詳細を確認することができる。
ここで、デフォルトで設定されているファイアウォールのルールを見ると、以下のようにicmp、ssh、RDP接続がどこからでも可能な設定となっている。
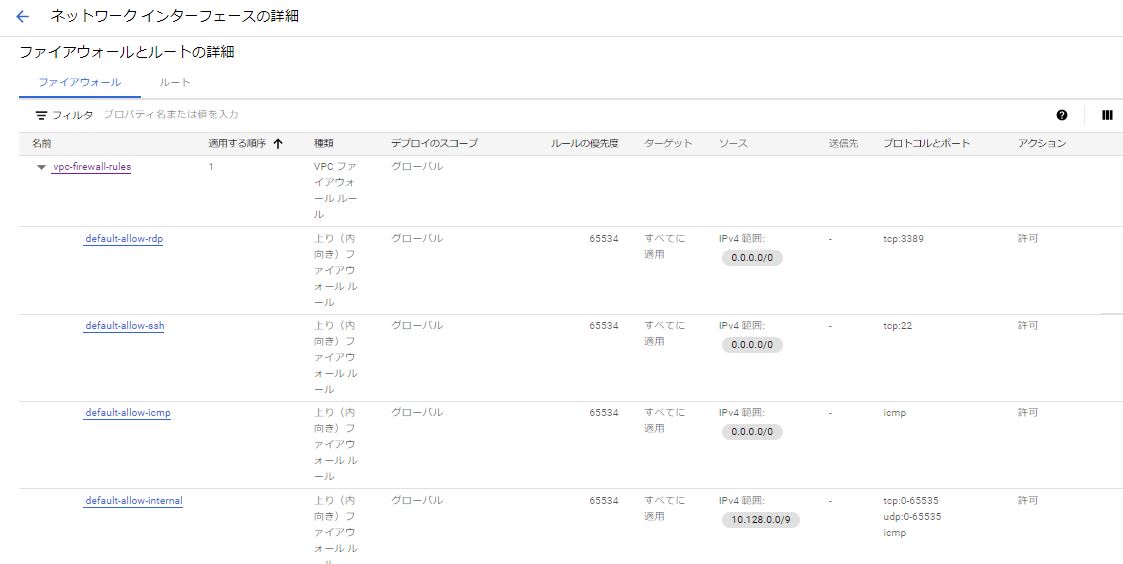
これだとセキュリティ的に不安なので、各ルールをクリックして編集し、送信元IPv4範囲が「0.0.0.0/0」となっている箇所を自分が使うソースIPに書き換えておく。
SSH接続の設定をする
こちらによると、インスタンスへのSSH接続は「OS Login」を使うのがおすすめとのこと。
しかし今回は検証用途で、簡単に設定・接続したいのでメタデータ内の SSH 認証鍵を使う方法でやってみる。
「SSH 認証鍵を作成する」を参考に、SSH認証鍵を作成する。
適当なLinuxサーバで以下を実行する。
認証鍵ペアを作成する
# ssh-keygen -t rsa -f ~/.ssh/gce-ssh-key -C dev-user -b 2048
Generating public/private rsa key pair.
Enter passphrase (empty for no passphrase):
Enter same passphrase again:
Your identification has been saved in /root/.ssh/gce-ssh-key.
Your public key has been saved in /root/.ssh/gce-ssh-key.pub.
The key fingerprint is:
SHA256:jBio6FJ/0o4KC7B5KD1JaZIFDJyRKPftwiTT6wKPMR0 dev-user
The key's randomart image is:
+---[RSA 2048]----+
|B.+              |
|o*..             |
|..oo..           |
|.+E.+o.o         |
|*.=*.o. S        |
|*X.o+..          |
|OB=.o.o          |
|=+o..=           |
|. .o. .          |
+----[SHA256]-----+

秘密鍵を確認
#ls -l ~/.ssh/gce-ssh-key
-rw------- 1 root root 1679 10月 14 23:30 /root/.ssh/gce-ssh-key

公開鍵を確認
#ls -l ~/.ssh/gce-ssh-key.pub
-rw-r--r-- 1 root root 390 10月 14 23:30 /root/.ssh/gce-ssh-key.pub
#cat /root/.ssh/gce-ssh-key.pub
ssh-rsa AAAAB3NzaC1yc2EAAAADAQABAAABAQDl7Yvw3k2R7wE/CKhF3etihDLijUVZGlEsIUYjvhny+B/z6eBBn3I2qJ7bPp2yfhh3PQYbb+o2mr/0nQhK0xKIzjNMK0Gqmii3He1nYRb27nFltQ9uAjHE/kkNax1tder9nruAv9YVjahP1raATUUCsiNEGYusS+TjpYY/+wFl74g2JyPMUknSwKpt1Ig+4Pmg1CtFiiDA1bdURSXdFIxOqYp5iZEwtepJne3sWgxqh5hAEtMP9SpArKHkuTUOLmyx3/ArEv5Fr4Fkp8wracc9MlBuDsUM5ih2z25mYGaKKCXEbA5sdy2O1vtOiaXAvPMTYLwv7VMmCkGFE5/bywuf dev-user
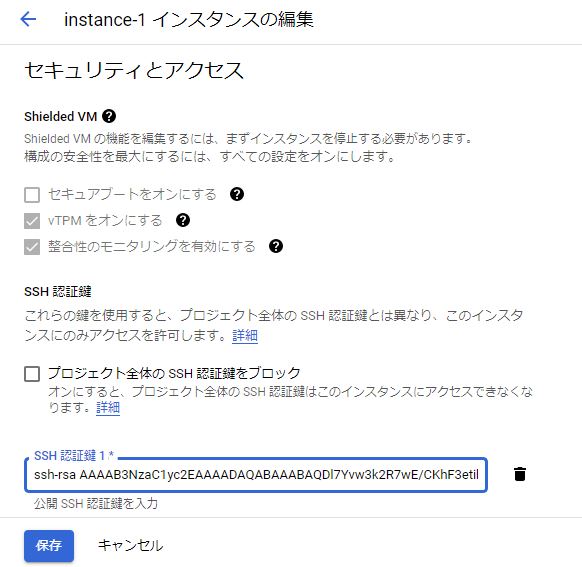
次に、「インスタンス メタデータに SSH 認証鍵を追加する」を参考に、インスタンスに公開鍵を登録する。
対象のインスタンスの詳細ページを表示し、「編集」をクリックする。

「セキュリティとアクセス」のSSH 認証鍵の「項目の追加」をクリックし、以下のように公開鍵(gce-ssh-key.pub)の中身を記載する。
その後、ページ下部の「保存」をクリックする。
これでインスタンスに公開鍵が登録されたので、秘密鍵を指定して外部IPに対しSSH接続してみる。
#ssh -i ~/.ssh/gce-ssh-key dev-user@34.168.77.125
Warning: Permanently added '34.168.77.125' (ECDSA) to the list of known hosts.
[dev-user@instance-1 ~]$ cat /etc/redhat-release
CentOS Linux release 7.9.2009 (Core)
→無事接続出来た。
gcloud CLI の設定
インスタンスには、最初からgcloud CLIがインストールされている。
$ gcloud version
Google Cloud SDK 404.0.0
alpha 2022.09.23
beta 2022.09.23
bq 2.0.78
bundled-python3-unix 3.9.12
core 2022.09.23
gcloud-crc32c 1.0.0
gsutil 5.14
しかし、このgcloud CLIだとコンポーネントのインストールやアップデートが出来ない。
(以下のように、代わりにyumを使うように言われてしまう。)
gcloud CLIでkubectlをインストールしてみる
$ gcloud components install kubectl
ERROR: (gcloud.components.install)
You cannot perform this action because the Google Cloud CLI component manager
is disabled for this installation. You can run the following command
to achieve the same result for this installation:

sudo yum install kubectl

gcloud CLIでコンポーネントをアップデートする
$ gcloud components update
To help improve the quality of this product, we collect anonymized usage data and anonymized stacktraces when
crashes are encountered; additional information is available at <https://cloud.google.com/sdk/usage-statistics>.
This data is handled in accordance with our privacy policy <https://cloud.google.com/terms/cloud-privacy-notice>.
 You may choose to opt in this collection now (by choosing 'Y' at the below prompt), or at any time in the future
 by running the following command:

    gcloud config set disable_usage_reporting false

Do you want to opt-in (y/N)?  y

Beginning update. This process may take several minutes.
ERROR: (gcloud.components.update)
You cannot perform this action because the Google Cloud CLI component manager
is disabled for this installation. You can run the following command
to achieve the same result for this installation:

sudo yum makecache && sudo yum update google-cloud-sdk-app-engine-go google-cloud-sdk-kpt google-cloud-sdk-kubectl-oidc google-cloud-sdk-harbourbridge google-cloud-sdk-firestore-emulator google-cloud-sdk-pubsub-emulator google-cloud-sdk-datastore-emulator google-cloud-sdk-spanner-emulator google-cloud-sdk-config-connector google-cloud-sdk google-cloud-sdk-terraform-tools google-cloud-sdk-cbt google-cloud-sdk-anthos-auth google-cloud-sdk-app-engine-python google-cloud-sdk-cloud-build-local google-cloud-sdk-nomos google-cloud-sdk-gke-gcloud-auth-plugin google-cloud-sdk-datalab google-cloud-sdk-bigtable-emulator kubectl google-cloud-sdk-app-engine-python-extras google-cloud-sdk-skaffold google-cloud-sdk-cloud-run-proxy google-cloud-sdk-bundled-python3 google-cloud-sdk-package-go-module google-cloud-sdk-local-extract google-cloud-sdk-app-engine-grpc google-cloud-sdk-minikube google-cloud-sdk-app-engine-java
こちらに以下のように記載されている。
最初から入っているgcloud CLIは恐らくyumでインストールされたものだと思われる。
注: APT や yum などのパッケージ マネージャーを使用して gcloud CLI をインストールしている場合、gcloud CLI コンポーネント マネージャーの手順は動作しません。この方法でインストールした場合には gcloud CLIコンポーネント・マネージャが無効になっているためです。代わりに、こちらのパッケージを使用してください。
以下を見ると、gcloud CLIコンポーネント・マネージャを使用したい場合には、パッケージ マネージャーでインストールされたgcloud CLIをアンインストールし、改めてインストーラーを使ってインストールすれば良いらしい。
stackoverflow.com
GCPのドキュメントでは、基本的にコンポーネントはgcloud CLIでインストールしているので、gcloud CLIコンポーネント・マネージャを使用出来る状態にしておきたい。
やってみる。
gcloud CLIをアンインストールする。
アンインストール
$ sudo yum remove google-cloud-sdk

アンインストールされたことを確認
$ gcloud version
-bash: /usr/bin/gcloud: そのようなファイルやディレクトリはありません
こちらの手順を参考に、gcloud CLIをインストールする。
前提としてPython3(3.5~3.9)が必要なため、インストールする。
pyenvのインストールする。
yumアップデート
$ sudo yum -y update

必要なツールをインストール
$ sudo yum -y install gcc zlib-devel bzip2 bzip2-devel readline-devel sqlite sqlite-devel openssl-devel tk-devel libffi-devel git make

pyenvをgit clone
$ git clone https://github.com/pyenv/pyenv.git ~/.pyenv

PATHを設定
$ echo 'export PYENV_ROOT="$HOME/.pyenv"' >> ~/.bashrc
$ echo 'command -v pyenv >/dev/null || export PATH="$PYENV_ROOT/bin:$PATH"' >> ~/.bashrc
$ echo 'eval "$(pyenv init -)"' >> ~/.bashrc

設定を確認
$ tail -n 3 ~/.bashrc
export PYENV_ROOT="$HOME/.pyenv"
command -v pyenv >/dev/null || export PATH="$PYENV_ROOT/bin:$PATH"
eval "$(pyenv init -)"

設定変更を反映
$ source ~/.bashrc

pyenvがインストールされたことを確認
$ pyenv --version
pyenv 2.3.5-2-g03a5d65
Python3.9をインストールする。
インストールできるPythonバージョンを確認
$ pyenv install --list

Python3.9.15をインストール
$ pyenv install 3.9.15
Downloading Python-3.9.15.tar.xz...
-> https://www.python.org/ftp/python/3.9.15/Python-3.9.15.tar.xz
Installing Python-3.9.15...
WARNING: The Python lzma extension was not compiled. Missing the lzma lib?
Installed Python-3.9.15 to /home/dev-user/.pyenv/versions/3.9.15
実行するPythonをPython3.9に設定する。
現在のPythonバージョンを確認
$ pyenv versions
* system (set by /home/dev-user/.pyenv/version)
  3.9.15
$ python -V
Python 2.7.5

バージョンを切り替え
$ pyenv global 3.9.15

切り替え後のPythonバージョンを確認
$ pyenv versions
  system
* 3.9.15 (set by /home/dev-user/.pyenv/version)
$ python -V
Python 3.9.15
gcloud CLIをインストールする。
gcloud CLIパッケージをダウンロード
$ curl -O https://dl.google.com/dl/cloudsdk/channels/rapid/downloads/google-cloud-cli-404.0.0-linux-x86_64.tar.gz

展開する
$ tar -xf google-cloud-cli-404.0.0-linux-x86_64.tar.gz

gcloud CLIのPATHを設定
$ ./google-cloud-sdk/install.sh \
  --usage-reporting false \
  --rc-path ~/.bashrc \
  --command-completion true \
  --path-update true

設定を確認
$ tail -n 5  ~/.bashrc
# The next line updates PATH for the Google Cloud SDK.
if [ -f '/home/dev-user/google-cloud-sdk/path.bash.inc' ]; then . '/home/dev-user/google-cloud-sdk/path.bash.inc'; fi

# The next line enables shell command completion for gcloud.
if [ -f '/home/dev-user/google-cloud-sdk/completion.bash.inc' ]; then . '/home/dev-user/google-cloud-sdk/completion.bash.inc'; fi

設定変更を反映
$ source ~/.bashrc

インストールされたgcloud CLIを確認
$ gcloud --version
Google Cloud SDK 404.0.0
bq 2.0.78
bundled-python3-unix 3.9.12
core 2022.09.23
gcloud-crc32c 1.0.0
gsutil 5.14
※install.sh実行時のオプションの意味は以下。
- --usage-reporting:gcloud CLI の改善のために匿名の使用統計情報を送信するかどうか。
- --rc-path:更新するプロファイルの場所
- --command-completion:コマンド補完を有効にするかどうか。
- --path-update:プロファイルのPATHを更新するかどうか。
※最初からインストールされていたgcloud CLIのプロパティが残っているので、初期化(gcloud init)は実行しなかった。
これで、gcloud CLIでコンポーネントのインストールやアップデートが出来るようになる。
gcloud CLIでkubectlをインストールしてみる
$ gcloud components install kubectl

インストールできた
$ kubectl version
Client Version: version.Info{Major:"1", Minor:"22+", GitVersion:"v1.22.14-dispatcher-dirty", GitCommit:"009f3ac5f1d09b1ec5d4dc811b6032271fe61f75", GitTreeState:"dirty", BuildDate:"2022-09-19T01:31:36Z", GoVersion:"go1.16.15", Compiler:"gc", Platform:"linux/amd64"}
The connection to the server localhost:8080 was refused - did you specify the right host or port?

gcloud CLIでコンポーネントをアップデートする
$ gcloud components update
おまけ:インスタンスの初期設定
検証用途なので、検証の邪魔になりがちなOSファイアウォールとSELinuxは停止・無効化しておく。
OSファイアウォールを無効化する。
$ sudo systemctl stop firewalld

$ sudo systemctl disable firewalld
Removed symlink /etc/systemd/system/multi-user.target.wants/firewalld.service.
Removed symlink /etc/systemd/system/dbus-org.fedoraproject.FirewallD1.service.

$ sudo systemctl status firewalld
● firewalld.service - firewalld - dynamic firewall daemon
   Loaded: loaded (/usr/lib/systemd/system/firewalld.service; disabled; vendor preset: enabled)
   Active: inactive (dead)
     Docs: man:firewalld(1)

$ sudo systemctl is-enabled firewalld
disabled
SELinuxを無効化する
$ getenforce
Enforcing

$ sudo sed -i".org" -e "s/^SELINUX=enforcing$/SELINUX=disabled/g" /etc/selinux/config

$ sudo reboot

$ getenforce
Disabled
参考文献
pyenv
Amazon Linux 2環境上にGCPコマンドラインツール・Google Cloud SDK動作環境を整える
SELinux無効化一行コマンド
Prometheus Node Exporter をAnsibleでインストールする(Rocky Linux 8)
PrometheusのExporterのひとつである、Node ExporterをAnsibleでインストールした時のメモ。
PrometheusやNode Exporterの設定は以下記事に記載してある。
環境
- Node Exporter:1.4.0
- 管理対象サーバ(Ansibleの実行先)のOS:RockyLinux8.6
- ansible:6.4.0
- ansible-core:2.13.4
実施内容
Ansibleのplaybookを準備
以下のディレクトリ、ファイルを作成した。
ディレクトリ構成は、Ansible公式ドキュメントのBest Practiceを参考にしている。
# tree --charset=c ansible
ansible
|-- ansible.cfg
|-- inventories
|   `-- production
|       |-- group_vars
|       |   `-- testservers.yml
|       `-- hosts
|-- roles
|   `-- install_node_exporter
|       |-- defaults
|       |   `-- main.yml
|       |-- files
|       |   `-- node_exporter-1.4.0.linux-amd64.tar.gz
|       |-- tasks
|       |   `-- main.yml
|       `-- templates
|           |-- node_exporter.service.j2
|           `-- node_exporter_envfile.j2
|-- site.yml
`-- testservers.yml
ansible/ansible.cfg
ansible実行時の設定。Ansibleが管理対象サーバへSSHする際に、ホスト鍵のチェックをしないようにしている。
[defaults]
host_key_checking = False
ansible/inventories/production/group_vars/testservers.yml
管理対象サーバへのアクセス情報を記載。
---
ansible_ssh_user: root
ansible_ssh_pass: password
ansible/inventories/production/hosts
管理対象サーバの接続先を記載。
[testservers]
192.168.10.123
roles/install_node_exporter/defaults/main.yml このロールで使う変数を定義している。
---
work_dir: /root/ansible_work/node_exporter      # このタスクの作業用ディレクトリ
node_exporter_user: node_exporter               # Node Exporterの実行ユーザ
node_exporter_group: "{{ node_exporter_user }}" # Node Exporterの実行ユーザの所属グループ
node_exporter_id: 65541                         # Node Exporterの実行ユーザ・グループのID(任意の値でよい)
node_exporter_version: 1.4.0                    # インストールするNode Exporterのバージョン
prometheus_dir: /opt/prometheus                 # Node Exporterの配置先
node_exporter_bin: /usr/local/bin               # Node Exporterの実行ファイルリンク配置先
node_exporter_envfile: /etc/sysconfig/node_exporter  # Node Exporterの変数定義ファイル
textfile_collector_dir: /var/lib/node_exporter/textfile_collector  # Textfile Collector用ファイルの配置先
ansible/roles/install_node_exporter/tasks/main.yml
実行するタスクを記載。Node Exporterをインストール、起動する内容。
---
- name: create work directory
  file:
    path: "{{ work_dir }}"
    state: directory
    owner: root
    group: root
    mode: 0755

- name: add group for node exporter
  group:
    name: "{{ node_exporter_group }}"
    gid: "{{ node_exporter_id }}"

- name: add user for node exporter
  user:
    name: "{{ node_exporter_user }}"
    group: "{{ node_exporter_group }}"
    uid: "{{ node_exporter_id }}"
    create_home: no
    shell: /sbin/nologin

- name: copy node exporter tarball
  copy:
    src: "node_exporter-{{ node_exporter_version }}.linux-amd64.tar.gz"
    dest: "{{ work_dir }}"

- name: create prometheus directory
  file:
    path: "{{ prometheus_dir }}"
    state: directory
    owner: root
    group: root
    mode: "0755"

- name: extract node exporter tarball
  unarchive:
    remote_src: yes
    src: "{{ work_dir }}/node_exporter-{{ node_exporter_version }}.linux-amd64.tar.gz"
    dest: "{{ prometheus_dir }}"
    owner: "{{ node_exporter_user }}"
    group: "{{ node_exporter_group }}"

- name: create node exporter symbolic link
  file:
    path: "{{ node_exporter_bin }}/node_exporter"
    state: link
    src: "{{ prometheus_dir }}/node_exporter-{{ node_exporter_version }}.linux-amd64/node_exporter"

- name: create node exporter systemd file
  template:
    src: node_exporter.service.j2
    dest: /etc/systemd/system/node_exporter.service
    owner: root
    group: root
    mode: 0664

- name: create node exporter environment directory
  template:
    src: node_exporter_envfile.j2
    dest: "{{ node_exporter_envfile }}"
    owner: root
    group: root
    mode: 0664

- name: create textfile collector directory
  file:
    path: "{{ textfile_collector_dir }}"
    state: directory
    owner: "{{ node_exporter_user }}"
    group: "{{ node_exporter_group }}"
    mode: 0755

- name: enable and start node_exporter
  systemd:
    daemon_reload: yes
    enabled: yes
    state: started
    name: node_exporter.service
roles/install_node_exporter/files/
管理対象サーバにアップロードする用のファイルを置く。
今回はインストール対象のNode Exporterのtarballを事前にダウンロードして配置している。
tarballはここからダウンロードできる。
# ls -l roles/install_node_exporter/files/
合計 9876
-rw-r--r-- 1 root root 10111972  9月 26 12:39 node_exporter-1.4.0.linux-amd64.tar.gz
roles/install_node_exporter/templates/node_exporter.service.j2
Node ExporterのSysytemdService用テンプレートファイル。
[Unit]
Description=Node Exporter

[Service]
User={{ node_exporter_user }}
EnvironmentFile=-{{ node_exporter_envfile }}
ExecStart={{ node_exporter_bin }}/node_exporter $OPTIONS

[Install]
WantedBy=multi-user.target
roles/install_node_exporter/templates/node_exporter_envfile.j2
Node Exporter実行時のオプション設定ファイルのテンプレートファイル。
OPTIONS="--collector.textfile.directory {{ textfile_collector_dir }}"
ansible/site.yml
実行するplaybook。個別のplaybookをimportして使う。
---
- import_playbook: testservers.yml
ansible/testservers.yml
個別のplaybook。
---
- hosts: testservers
  roles:
    - install_node_exporter
ansibleの実行
ansible-playbookを実行する。
# ansible-playbook -i inventories/production/hosts site.yml
管理対象のサーバに接続し、node_exporterサービスが正常に起動していればOK。
# systemctl status node_exporter
● node_exporter.service - Node Exporter
   Loaded: loaded (/etc/systemd/system/node_exporter.service; enabled; vendor preset: disabled)
   Active: active (running) since Tue 2022-10-11 11:27:43 UTC; 1h 42min ago
 Main PID: 36046 (node_exporter)
    Tasks: 5 (limit: 10992)
   Memory: 18.7M
   CGroup: /system.slice/node_exporter.service
           mq36046 /usr/local/bin/node_exporter --collector.textfile.directory /var/lib/node_exporter/textfile_collector

10月 11 11:27:43 ip-192-168-10-123.ap-northeast-1.compute.internalmydomain.local node_exporter[36046]: ts=2022-10-11T11:27:43.337Z caller=node_exporter.go:115 level=info collector=thermal_zone
10月 11 11:27:43 ip-192-168-10-123.ap-northeast-1.compute.internalmydomain.local node_exporter[36046]: ts=2022-10-11T11:27:43.337Z caller=node_exporter.go:115 level=info collector=time
10月 11 11:27:43 ip-192-168-10-123.ap-northeast-1.compute.internalmydomain.local node_exporter[36046]: ts=2022-10-11T11:27:43.337Z caller=node_exporter.go:115 level=info collector=timex
10月 11 11:27:43 ip-192-168-10-123.ap-northeast-1.compute.internalmydomain.local node_exporter[36046]: ts=2022-10-11T11:27:43.337Z caller=node_exporter.go:115 level=info collector=udp_queues
10月 11 11:27:43 ip-192-168-10-123.ap-northeast-1.compute.internalmydomain.local node_exporter[36046]: ts=2022-10-11T11:27:43.337Z caller=node_exporter.go:115 level=info collector=uname
10月 11 11:27:43 ip-192-168-10-123.ap-northeast-1.compute.internalmydomain.local node_exporter[36046]: ts=2022-10-11T11:27:43.337Z caller=node_exporter.go:115 level=info collector=vmstat
10月 11 11:27:43 ip-192-168-10-123.ap-northeast-1.compute.internalmydomain.local node_exporter[36046]: ts=2022-10-11T11:27:43.337Z caller=node_exporter.go:115 level=info collector=xfs
10月 11 11:27:43 ip-192-168-10-123.ap-northeast-1.compute.internalmydomain.local node_exporter[36046]: ts=2022-10-11T11:27:43.337Z caller=node_exporter.go:115 level=info collector=zfs
10月 11 11:27:43 ip-192-168-10-123.ap-northeast-1.compute.internalmydomain.local node_exporter[36046]: ts=2022-10-11T11:27:43.338Z caller=node_exporter.go:199 level=info msg="Listening on" address=:9100
10月 11 11:27:43 ip-192-168-10-123.ap-northeast-1.compute.internalmydomain.local node_exporter[36046]: ts=2022-10-11T11:27:43.338Z caller=tls_config.go:195 level=info msg="TLS is disabled." http2=false
まとめ
- RockyLinux8へのPrometheus Node ExporterのインストールをAnsibleで自動化できた。
参考文献
Ansibleの実行環境をDockerコンテナにする
Ansibleを使う際に、以下のような環境面での悩みが出てくるケースがある。
- 複数の構成管理サーバにAnsibleをインストールするのが手間。
- Ansibleの実行環境にはPythonが必要だが、Ansibleのために特定バージョンのPythonをインストールして環境が汚れるのが嫌。
- 複数のバージョンのAnsibleを同じサーバで実行させたい場合、共存させるのが面倒(というか共存できない?)。
→これらは、Ansibleの実行環境をDockerコンテナにすれば解決できる。
という訳で、Ansible実行用のDockerコンテナを用意してみる。
環境
- DockerホストのOS:RockyLinux8.6
- 管理対象サーバ(Ansibleの実行先)のOS:RockyLinux8.6
- Docker:20.10.18
- ansible:7.3.0
- ansible-core:2.14.3
実施内容
Ansibleの最新バージョンを確認
公式ドキュメントのAnsible Roadmapによると、2023年3月現在の最新安定版のバージョンは7系。
pipを使って、インストールできる最新版を確認する。
# docker run --rm -it rockylinux:8.6 /bin/bash

# dnf module -y install python39

# python3 -m pip install ansible==
WARNING: Running pip install with root privileges is generally not a good idea. Try `python3 -m pip install --   user` instead.
ERROR: Could not find a version that satisfies the requirement ansible== (from versions: 1.0, 1.1, 1.2, 1.2.1,    1.2.2, 1.2.3, 1.3.0, 1.3.1, 1.3.2, 1.3.3, 1.3.4, 1.4, 1.4.1, 1.4.2, 1.4.3, 1.4.4, 1.4.5, 1.5, 1.5.1, 1.5.2, 1   .5.3, 1.5.4, 1.5.5, 1.6, 1.6.1, 1.6.2, 1.6.3, 1.6.4, 1.6.5, 1.6.6, 1.6.7, 1.6.8, 1.6.9, 1.6.10, 1.7, 1.7.1, 1.   7.2, 1.8, 1.8.1, 1.8.2, 1.8.3, 1.8.4, 1.9.0.1, 1.9.1, 1.9.2, 1.9.3, 1.9.4, 1.9.5, 1.9.6, 2.0.0.0, 2.0.0.1, 2.0   .0.2, 2.0.1.0, 2.0.2.0, 2.1.0.0, 2.1.1.0, 2.1.2.0, 2.1.3.0, 2.1.4.0, 2.1.5.0, 2.1.6.0, 2.2.0.0, 2.2.1.0, 2.2.2   .0, 2.2.3.0, 2.3.0.0, 2.3.1.0, 2.3.2.0, 2.3.3.0, 2.4.0.0, 2.4.1.0, 2.4.2.0, 2.4.3.0, 2.4.4.0, 2.4.5.0, 2.4.6.0   , 2.5.0a1, 2.5.0b1, 2.5.0b2, 2.5.0rc1, 2.5.0rc2, 2.5.0rc3, 2.5.0, 2.5.1, 2.5.2, 2.5.3, 2.5.4, 2.5.5, 2.5.6, 2.   5.7, 2.5.8, 2.5.9, 2.5.10, 2.5.11, 2.5.12, 2.5.13, 2.5.14, 2.5.15, 2.6.0a1, 2.6.0a2, 2.6.0rc1, 2.6.0rc2, 2.6.0   rc3, 2.6.0rc4, 2.6.0rc5, 2.6.0, 2.6.1, 2.6.2, 2.6.3, 2.6.4, 2.6.5, 2.6.6, 2.6.7, 2.6.8, 2.6.9, 2.6.10, 2.6.11,    2.6.12, 2.6.13, 2.6.14, 2.6.15, 2.6.16, 2.6.17, 2.6.18, 2.6.19, 2.6.20, 2.7.0.dev0, 2.7.0a1, 2.7.0b1, 2.7.0rc   1, 2.7.0rc2, 2.7.0rc3, 2.7.0rc4, 2.7.0, 2.7.1, 2.7.2, 2.7.3, 2.7.4, 2.7.5, 2.7.6, 2.7.7, 2.7.8, 2.7.9, 2.7.10,    2.7.11, 2.7.12, 2.7.13, 2.7.14, 2.7.15, 2.7.16, 2.7.17, 2.7.18, 2.8.0a1, 2.8.0b1, 2.8.0rc1, 2.8.0rc2, 2.8.0rc   3, 2.8.0, 2.8.1, 2.8.2, 2.8.3, 2.8.4, 2.8.5, 2.8.6, 2.8.7, 2.8.8, 2.8.9, 2.8.10, 2.8.11, 2.8.12, 2.8.13, 2.8.1   4, 2.8.15, 2.8.16rc1, 2.8.16, 2.8.17rc1, 2.8.17, 2.8.18rc1, 2.8.18, 2.8.19rc1, 2.8.19, 2.8.20rc1, 2.8.20, 2.9.   0b1, 2.9.0rc1, 2.9.0rc2, 2.9.0rc3, 2.9.0rc4, 2.9.0rc5, 2.9.0, 2.9.1, 2.9.2, 2.9.3, 2.9.4, 2.9.5, 2.9.6, 2.9.7,    2.9.8, 2.9.9, 2.9.10, 2.9.11, 2.9.12, 2.9.13, 2.9.14rc1, 2.9.14, 2.9.15rc1, 2.9.15, 2.9.16rc1, 2.9.16, 2.9.17   rc1, 2.9.17, 2.9.18rc1, 2.9.18, 2.9.19rc1, 2.9.19, 2.9.20rc1, 2.9.20, 2.9.21rc1, 2.9.21, 2.9.22rc1, 2.9.22, 2.   9.23rc1, 2.9.23, 2.9.24rc1, 2.9.24, 2.9.25rc1, 2.9.25, 2.9.26rc1, 2.9.26, 2.9.27rc1, 2.9.27, 2.10.0a1, 2.10.0a   2, 2.10.0a3, 2.10.0a4, 2.10.0a5, 2.10.0a6, 2.10.0a7, 2.10.0a8, 2.10.0a9, 2.10.0b1, 2.10.0b2, 2.10.0rc1, 2.10.0   , 2.10.1, 2.10.2, 2.10.3, 2.10.4, 2.10.5, 2.10.6, 2.10.7, 3.0.0b1, 3.0.0rc1, 3.0.0, 3.1.0, 3.2.0, 3.3.0, 3.4.0   , 4.0.0a1, 4.0.0a2, 4.0.0a3, 4.0.0a4, 4.0.0b1, 4.0.0b2, 4.0.0rc1, 4.0.0, 4.1.0, 4.2.0, 4.3.0, 4.4.0, 4.5.0, 4.   6.0, 4.7.0, 4.8.0, 4.9.0, 4.10.0, 5.0.0a1, 5.0.0a2, 5.0.0a3, 5.0.0b1, 5.0.0b2, 5.0.0rc1, 5.0.1, 5.1.0, 5.2.0,    5.3.0, 5.4.0, 5.5.0, 5.6.0, 5.7.0, 5.7.1, 5.8.0, 5.9.0, 5.10.0, 6.0.0a1, 6.0.0a2, 6.0.0a3, 6.0.0b1, 6.0.0b2, 6   .0.0rc1, 6.0.0, 6.1.0, 6.2.0, 6.3.0, 7.3.0, 6.5.0, 6.6.0, 6.7.0, 7.0.0a1, 7.0.0a2, 7.0.0b1, 7.0.0rc1, 7.0.0, 7   .1.0, 7.2.0, 7.3.0)
ERROR: No matching distribution found for ansible==
→7.3.0が最新なようなので、これを使うことにする。
Ansible実行用のDockerイメージをビルドする
Dockerfileを作成する。
Dockerfile_ansible
# ベースイメージ
FROM rockylinux:8.6

# 変数定義
ARG ANSIBLE_VERSION

# 必要なパッケージのインストール
RUN dnf module -y install python39 && \
    dnf -y install openssh-clients \
    sshpass && \
    dnf clean all && \
    rm -rf /var/cache/dnf/*

# Ansibleのインストール
RUN python3 -m pip install --no-cache-dir ansible==$ANSIBLE_VERSION

# ロケールを日本語に設定
RUN dnf -y install glibc-locale-source glibc-langpack-en && \
    dnf clean all && \
    rm -rf /var/cache/dnf/*
RUN localedef -f UTF-8 -i ja_JP ja_JP.utf8
RUN echo 'LANG="ja_JP.UTF-8"' >  /etc/locale.conf

# タイムゾーンをJSTに設定
RUN echo 'ZONE="Asia/Tokyo"' > /etc/sysconfig/clock
RUN rm -f /etc/localtime
RUN ln -fs /usr/share/zoneinfo/Asia/Tokyo /etc/localtime

# コンテナログイン時のカレントディレクトリを設定
WORKDIR /work/ansible
→Dockerfileの解説
- ベースイメージがRockyLinux8.6なのは使い慣れているからで、特に意味は無い。他のOSで作っても良い。
- Ansibleのインストールコマンドは、Ansible公式ドキュメントのここを参考にしている。
- openssh-clientsは、Ansibleから管理対象サーバへ接続するために必要なのでインストールした。
- sshpassは、管理対象サーバへ接続する際にパスワード認証を使う場合は必要なため、インストールした。
- Ansibleで使うモジュールによっては他にもパッケージが必要になるので、適宜追加すること。
- インストールするAnsibleのバージョンを制御できるよう、ARGにて変数ANSIBLE_VERSIONを定義し、Ansibleインストール時に指定している。
変数に設定する値は、後ほど「docker build」実行時に--build-argオプションで指定する。
詳細はDockerの公式ドキュメントのここを参照。 - dnf実行時の書き方については、RedHatの「How to build tiny container images」を参考にした。
- ロケールとタイムゾーンの設定は必須ではないが、自前のコンテナイメージ作成時はいつもやっているので入れている。
Ansibleバージョンを7.3.0と指定し、コンテナイメージをビルドする。
インストールしたいAnsibleのバージョンを環境変数に格納
# export ANSIBLE_VERSION=7.3.0

Dockerイメージをビルド
# docker build --no-cache=true -f Dockerfile_ansible -t ansible:$ANSIBLE_VERSION --build-arg ANSIBLE_VERSION=$ANSIBLE_VERSION .

ビルドされたイメージを確認
# docker images | grep ansible | grep $ANSIBLE_VERSION
ansible               7.3.0     ac001dbb28c2   2 minutes ago   657MB

ビルドされたイメージを起動し、想定通りのAnsibleバージョンがインストールされたことを確認
# docker run --rm -it ansible:$ANSIBLE_VERSION python3 -m pip freeze | grep ansible
ansible==7.3.0
ansible-core==2.13.4
ビルドしたイメージを使ってansible-playbookを実行する
Dockerホスト(上記イメージを起動するサーバ)にansibleで使うファイルを準備する。
今回は、Dockerホストの/root/ansibleディレクリに以下のように配置した。
ディレクトリ構成は、Ansible公式ドキュメントのBest Practiceを参考にしている。
# cd /root
# tree --charset=c ansible
ansible
|-- ansible.cfg
|-- inventories
|   `-- production
|       |-- group_vars
|       |   `-- testservers.yml
|       `-- hosts
|-- roles
|   `-- test
|       |-- files
|       |   `-- test.txt
|       `-- tasks
|           `-- main.yml
|-- site.yml
`-- testservers.yml
ansible/ansible.cfg
ansible実行時の設定。Ansibleが管理対象サーバへSSHする際に、ホスト鍵のチェックをしないようにしている。
[defaults]
host_key_checking = False
ansible/inventories/production/group_vars/testservers.yml
管理対象サーバへのアクセス情報を記載。
---
ansible_ssh_user: root
ansible_ssh_pass: password
ansible/inventories/production/hosts
管理対象サーバの接続先を記載。
[testservers]
192.168.10.123
ansible/roles/test/tasks/main.yml
test.txtというファイルを管理対象サーバの/tmpディレクトリに転送するだけの処理。
---
- name: copy test file
  copy:
    src: "test.txt"
    dest: "/tmp"
ansible/roles/test/files/test.txt
test
ansible/site.yml
実行するplaybook。個別のplaybookをimportして使う。
---
- import_playbook: testservers.yml
ansible/testservers.yml
個別のplaybook。
---
- hosts: testservers
  roles:
    - test
先ほどビルドしたコンテナイメージを指定し、コンテナを起動する。 DockerfileでWORKDIRとして指定したコンテナ内のディレクトリ(今回は「/work/ansible」)に、Dockerホストのansible用ファイル置き場(今回は「/root/ansible」)をマウントする。
# export ANSIBLE_VERSION=7.3.0
# docker run --rm -it -v /root/.ssh/:/root/.ssh/ -v /root/ansible:/work/ansible ansible:$ANSIBLE_VERSION ls -l
total 12
-rw-r--r-- 1 root root 37 Oct 10 23:02 ansible.cfg
drwxr-xr-x 3 root root 24 Oct 10 20:27 inventories
drwxr-xr-x 3 root root 18 Oct 10 21:47 roles
-rw-r--r-- 1 root root 39 Oct 10 20:38 site.yml
-rw-r--r-- 1 root root 45 Oct 10 21:42 testservers.yml
→「docker run」した際のカレントディレクトリから、Dockerホストのansible用ファイルにアクセスできることが確認できる。
ansible-playbookを実行する。
# export ANSIBLE_VERSION=7.3.0
# docker run --rm -it -v /root/.ssh/:/root/.ssh/ -v /root/ansible:/work/ansible ansible:$ANSIBLE_VERSION ansible-playbook -i inventories/production/hosts site.yml

# docker run --rm -it -v /root/.ssh/:/root/.ssh/ -v /root/ansible:/work/ansible ansible:$ANSIBLE_VERSION ansible-playbook -i inventories/production/hosts site.yml

PLAY [testservers] *******************************************************************************************

TASK [Gathering Facts] ***************************************************************************************
ok: [192.168.10.123]

TASK [test : copy test file] *********************************************************************************
changed: [192.168.10.123]

PLAY RECAP ***************************************************************************************************
192.168.10.123               : ok=2    changed=1    unreachable=0    failed=0    skipped=0    rescued=0    ignored=0
→無事に実行された。
管理対象サーバにSSHして、/tmpディレクトリにtest.txtファイルが転送されていることが確認できる。
# ssh root@192.168.10.123
# cat /tmp/test.txt
test
毎回「docker run ~」を入力するのは手間なので、エイリアスを使って簡単に実行できるようにする。
Dockerホストの「~/.bashrc」に以下の2行を追記する。
export ANSIBLE_VERSION=7.3.0
alias ansible-playbook='docker run --rm -it -v /root/.ssh/:/root/.ssh/ -v /root/ansible:/work/ansible ansible:$ANSIBLE_VERSION ansible-playbook'
試してみる。
変更を反映
# source ~/.bashrc

エイリアスを指定してplaybookを実行する。
# ansible-playbook -i inventories/production/hosts site.yml

PLAY [testservers] *******************************************************************************************

TASK [Gathering Facts] ***************************************************************************************
ok: [192.168.10.123]

TASK [test : copy test file] *********************************************************************************
ok: [192.168.10.123]

PLAY RECAP ***************************************************************************************************
192.168.10.123               : ok=2    changed=0    unreachable=0    failed=0    skipped=0    rescued=0    ignored=0
→「ansible-playbook」を実行するだけでansibleコンテナを使ってansible-playbookを実行できるようになった。
別バージョンのAnsibleも実行したい場合は、該当バージョンのAnsibleがインストールされたDockerイメージを用意し、環境変数「ANSIBLE_VERSION」の値を変えることで実行するバージョンを制御できる。
まとめ
- Ansibleの実行環境をDockerコンテナにすることができた。Dockerさえインストールされていれば、簡単にAnsibleの実行環境を整備できる。
参考文献
Node ExporterのTextfile Collectorで独自メトリクスを収集する
Node Exporterでハードウェア・OSのメトリクスを収集して、Prometheus、Grafanaで可視化しているのだが、独自メトリクスも可視化したくなった。
Prometheus用のExporterを自作すればよいらしいが、Webサーバも起動する必要があるし、少し面倒そう。
Node ExporterのTextfile Collectorを使えば簡単に独自メトリクスを収集できそうなので、試してみる。
※今回使う環境の構築方法や、Prometheus、Grafana、Node Exporterの設定は以下記事参照。 tk-ch.hatenablog.com
環境
- OS:RockyLinux8.6
- Prometheus:v2.37.1
- Grafana:9.1.6
- Node Exporter:1.4.0
- Python:3.9.7
- prometheus_client:0.14.1
実施内容
Node ExporterのREADMEによると、Node Exporterは、--collector.textfile.directoryオプションで指定したディレクトリ内の「*.prom」という名前のファイルに記載した内容を収集する。
これを利用して独自メトリクスを収集できるようなので、使ってみる。
コマンド実行で試してみる
先ほどのREADMEを参考に、本当に収集されるか試してみる。
Node Exporterが動作している管理対象サーバで、以下を実行する。
(Node Exporterは「--collector.textfile.directory /var/lib/node_exporter/textfile_collector」というオプションで動作している。)
「my_batch_job_completion_time」というメトリクス名で、現在時刻を記載したファイルを作成する
# echo my_batch_job_completion_time $(date +%s) > /var/lib/node_exporter/textfile_collector/my_batch_job.prom.$$
# mv /var/lib/node_exporter/textfile_collector/my_batch_job.prom.$$ /var/lib/node_exporter/textfile_collector/my_batch_job.prom

作成したファイルの中身を確認する
# cat /var/lib/node_exporter/textfile_collector/my_batch_job.prom
my_batch_job_completion_time 1665059541

Node Exporterの収集メトリクスを確認すると「my_batch_job_completion_time」が収集されていることが確認できる
# curl -s http://localhost:9100/metrics | grep my_batch_job_completion_time
# HELP my_batch_job_completion_time Metric read from /var/lib/node_exporter/textfile_collector/my_batch_job.prom
# TYPE my_batch_job_completion_time untyped
my_batch_job_completion_time 1.665059541e+09
→想定通り、ファイルに記載した内容がメトリクスとして収集された。
上記ではコマンドを手動実行したが、実際には独自メトリクスを収集してファイルに記載するスクリプトを定期実行することになる。
スクリプトの例はここにある。
※上記手順では、my_batch_job.promに直接リダイレクトせず、my_batch_job.prom.$$をリネームする形にしている。
これはファイルをアトミックに更新することで、Node Exporterが更新途中のテキストファイルを読み込まないようにするため。
更新途中のデータを読み込むと、エラー発生や不正なデータを収集してしまうリスクがある。
参考:https://www.robustperception.io/atomic-writes-and-the-textfile-collector/
シェルスクリプトで独自メトリクスの値を定期更新する
ランダムな数値をmy_random_numberというメトリクス名で更新するスクリプトを作成する。
メトリクスのタイプについてはここに記載がある。
今回はランダムな数値なので、gaugeにした。
# mkdir /root/script

# vim /root/script/output_random.sh
output_random.sh
#!/bin/bash

# テキストファイルの情報
TEXT_DIR="/var/lib/node_exporter/textfile_collector"
TEXT_BASE="my_random_number"
TEXT_EXT=".prom"
TEXT_PATH=${TEXT_DIR}/${TEXT_BASE}${TEXT_EXT}

# メトリクスの情報
METRICS_NAME="my_random_number"
METRICS_HELP="My random number"
METRICS_TYPE="gauge"

# メトリクスの説明・タイプの出力
echo "# HELP ${METRICS_NAME} ${METRICS_HELP}" > ${TEXT_PATH}.$$
echo "# TYPE ${METRICS_NAME} ${METRICS_TYPE}" >> ${TEXT_PATH}.$$

# メトリクス名と値の出力
echo "my_random_number $RANDOM" >> ${TEXT_PATH}.$$

# テキストファイルの更新
mv ${TEXT_PATH}.$$ ${TEXT_PATH}
実行して、テキストファイルが作成されること、想定通りメトリクス収集されていることを確認する
実行権限を付与
# chmod a+x /root/script/output_random.sh

実行
# /root/script/output_random.sh

テキストファイルを確認
# cat /var/lib/node_exporter/textfile_collector/my_random_number.prom
# HELP my_random_number My random number
# TYPE my_random_number gauge
my_random_number 16633

メトリクスとして収集されていることを確認
# curl -s http://localhost:9100/metrics | grep my_random_number
# HELP my_random_number My random number
# TYPE my_random_number gauge
my_random_number 16633
node_textfile_mtime_seconds{file="/var/lib/node_exporter/textfile_collector/my_random_number.prom"} 1.665064408e+09
想定通り出力されている。
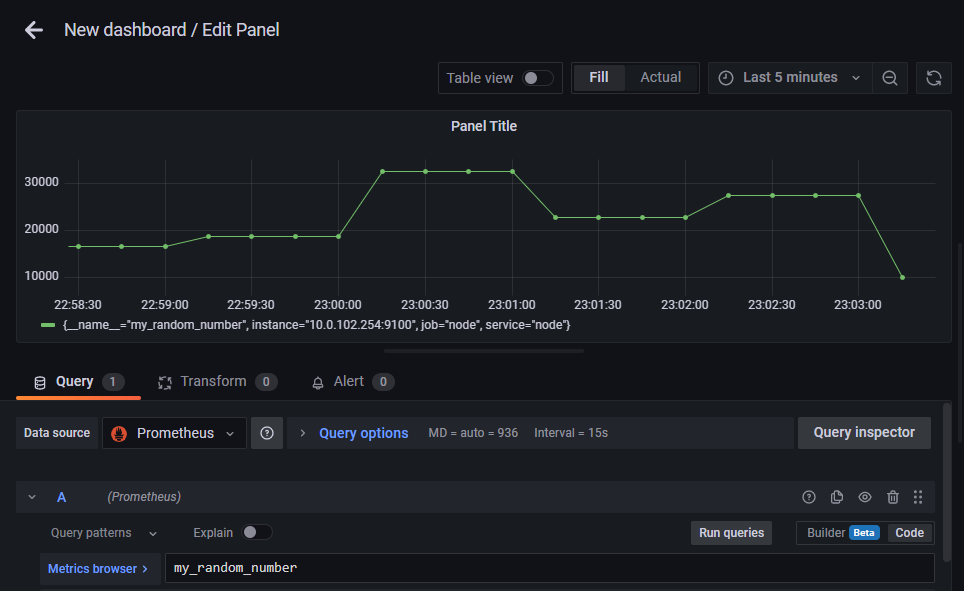
毎分定期実行されるようcronに設定する。
# crontab -e
* * * * * /root/script/output_random.sh
暫く待ってからGrafanaのダッシュボード作成画面で「my_random_number」をクエリとしてグラフ作成すると、以下のようにmy_random_numberの値を可視化できる。
Pythonスクリプトで独自メトリクスの値を定期更新する
Prometheus公式のPython用Client(prometheus-client)がある。
Pythonプログラムに仕込んでメトリクス収集したりできるようだが、これを使ってTextfile Collector用のテキストファイルを作成できる。
こちらを参考に試してみる。
Pythonのインストール
# dnf module -y install python39

# python3 -V
Python 3.9.7
prometheus-clientのインストール
# pip3 install prometheus-client
WARNING: Running pip install with root privileges is generally not a good idea. Try `pip3 install --user` instead.
Collecting prometheus-client
  Downloading prometheus_client-0.14.1-py3-none-any.whl (59 kB)
     |????????????????????????????????| 59 kB 10.4 MB/s
Installing collected packages: prometheus-client
Successfully installed prometheus-client-0.14.1
シェルスクリプトの時と同様、ランダムな数値をmy_random_numberというメトリクス名で更新するスクリプトを作成する。
# vim output_random.py
output_random.py
#!/usr/bin/env python3

import random
from prometheus_client import CollectorRegistry, Gauge, write_to_textfile

FILE_PATH = '/var/lib/node_exporter/textfile_collector/my_random_number_py.prom'
METRICS_NAME="my_random_number_py"
METRICS_HELP="My random number by python script"

registry = CollectorRegistry()
g = Gauge(METRICS_NAME, METRICS_HELP, registry=registry)
g.set(random.randint(0, 10000))
write_to_textfile(FILE_PATH, registry)
- Gauge()の第1引数はメトリック名、第2引数はヘルプ文字列。
- コマンド、シェルスクリプトでファイル更新する際は、一時ファイルを経由することでアトミックなファイル更新を行っていた。
prometheus-clientでは、write_to_textfile()関数がこの処理を行ってくれている。
※ここにあるwrite_to_textfile()のソースを見ると、一時ファイルを経由して更新する処理になっていることが分かる。
実行権限を付与
# chmod a+x /root/script/output_random.py

実行
# /root/script/output_random.py

出力を確認
# cat /var/lib/node_exporter/textfile_collector/my_random_number_py.prom
# HELP my_random_number_py My random number by python script
# TYPE my_random_number_py gauge
my_random_number_py 5277.0

メトリクスとして収集されていることを確認
# curl -s http://localhost:9100/metrics | grep my_random_number_py
# HELP my_random_number_py My random number by python script
# TYPE my_random_number_py gauge
my_random_number_py 1915
node_textfile_mtime_seconds{file="/var/lib/node_exporter/textfile_collector/my_random_number_py.prom"} 1.665068941e+09
想定通り収集されている。
あとはシェルスクリプトの時と同様に、定期実行してやればよい。
prometheus-clientを使うと、出力フォーマットを適切に整形してアトミックにテキストファイルを作成・更新してくれることが分かった。
まとめ
サーバーのメトリクスを可視化する(Prometheus、Grafana、Node Exporter、cAdvisor)
サーバーのメトリクスを可視化して確認できるようにしたい。
PrometheusとGrafanaでやってみる。
環境
- OS:RockyLinux8.6
- Prometheus:v2.37.1
- Grafana:9.1.6
- Node Exporter:1.4.0
- cAdvisor:0.45.0
構成図
今回構築する環境の構成イメージは以下の通り。
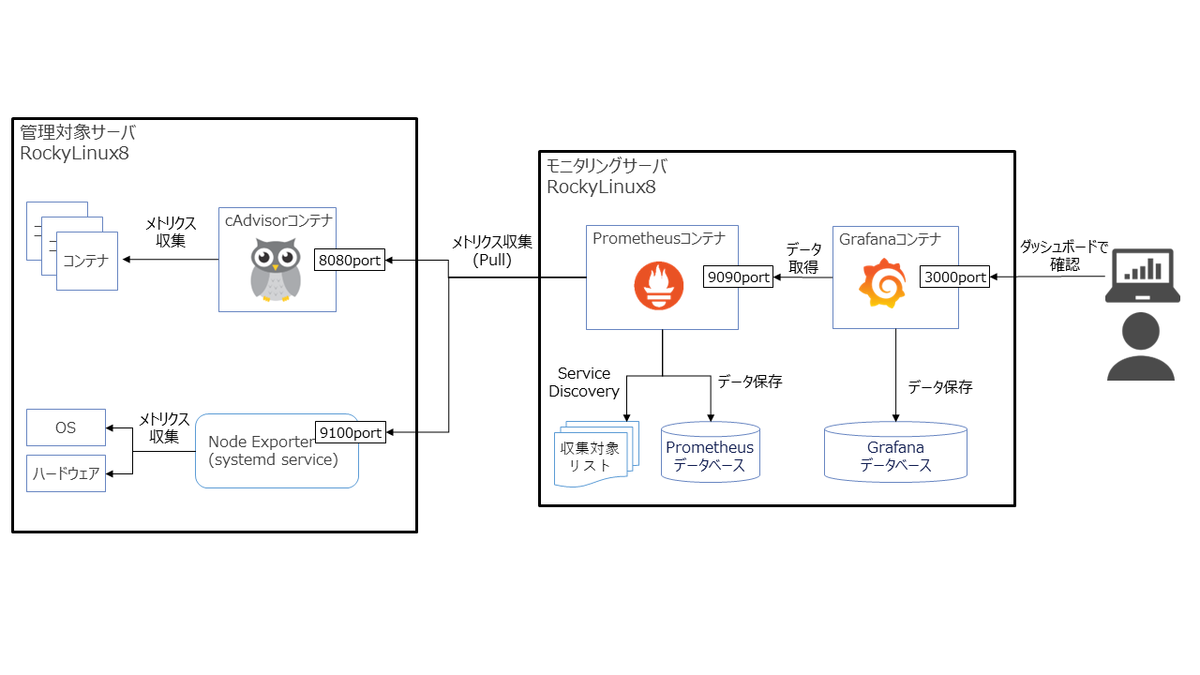
- 出来るだけお手軽かつ、他の環境にもすぐに再現できる構成にしたいので、Prometheus、GrafanaはDockerコンテナで構成する。
- ハードウェア・OSの標準的なメトリクスの取得は、Prometheusの代表的なexporterであるNode Exporterで収集する。
- コンテナもよく使うので、コンテナのメトリクスも収集したい。cAdvisorで収集する。
※使用するソフトウェア・ツール一覧 prometheus.io
モニタリングサーバを構築する
DockerとDocker Composeインストール
こちらを参照し、Dockerをインストールする
# dnf remove docker \
                  docker-client \
                  docker-client-latest \
                  docker-common \
                  docker-latest \
                  docker-latest-logrotate \
                  docker-logrotate \
                  docker-engine

# dnf config-manager --add-repo https://download.docker.com/linux/centos/docker-ce.repo

# dnf -y install docker-ce docker-ce-cli containerd.io

# systemctl start docker

# docker info | grep Version
 Server Version: 20.10.18
 Cgroup Version: 1
 Kernel Version: 5.18.9-1.el8.elrepo.x86_64

# systemctl enable docker

# docker run hello-world
Unable to find image 'hello-world:latest' locally
latest: Pulling from library/hello-world
2db29710123e: Pull complete
Digest: sha256:62af9efd515a25f84961b70f973a798d2eca956b1b2b026d0a4a63a3b0b6a3f2
Status: Downloaded newer image for hello-world:latest

Hello from Docker!
こちらを参照し、Docker Composeをインストールする
# dnf -y update

# dnf -y install docker-compose-plugin

# docker compose version
Docker Compose version v2.10.2
PrometeusとGrafanaを起動する
PrometheusとGrafanaをコンテナで起動する方法はそれぞれ以下に記載されている。
今回はコンテナをDocker Composeで管理したいので、上記ページを参考にcomposeファイルを書いてみる。
composeファイルの書式は公式ドキュメントに従う。
composeファイル配置用ディレクトリを作成する(どこでもよい)
# mkdir -p /opt/docker/monitoring

composeファイルを作成する
# vim /opt/docker/monitoring/docker-compose.yml
services:
  prometheus:
    image: prom/prometheus:v2.37.1
    container_name: prometheus-2.37.1
    ports:
      - "9090:9090"
    volumes:
      - /opt/docker/monitoring/prometheus/etc:/etc/prometheus  # prometheusの設定ファイル置き場
      - /opt/docker/monitoring/prometheus/data:/prometheus  # prometheusのデータ保管場所
    command:
      - '--config.file=/etc/prometheus/prometheus.yml'
      - '--storage.tsdb.path=/prometheus'
      - '--storage.tsdb.retention.time=31d'  # ローカルストレージへのメトリクス保存期間
      - '--web.console.libraries=/usr/share/prometheus/console_libraries'
      - '--web.console.templates=/usr/share/prometheus/consoles'
  grafana:
    image: grafana/grafana-oss:9.1.6
    container_name: grafana-oss-9.1.6
    ports:
      - "3000:3000"
    volumes:
      - /opt/docker/monitoring/grafana/data:/var/lib/grafana  # Grafanaのデータ保管場所
→composeファイル記載時のポイントは以下。
- ローカルストレージへのメトリクス保存期間はデフォルトだと15日間。短いので、今回は31日間に変更してみた。
Prometheusのストレージに関するオプションはこちらを参照。 - コンテナ内のデータはコンテナ終了時に消えてしまうため、永続化したいファイルの配置ディレクトリは、volumesでホストのストレージをマウントしている。
- Prometheusのデータ保管場所は「/prometheus」だが、公式ドキュメントにはこの記載が見当たらなかった。
最終的にprom/prometheusイメージのDockerfileを確認して特定した。
次に、Prometheusコンテナのvolumes用ディレクトリを作成する。
ディレクトリの所有ユーザ/グループはコンテナの実行ユーザ/グループと揃える。
# mkdir -p /opt/docker/monitoring/prometheus/etc

# mkdir /opt/docker/monitoring/prometheus/data

# chown 65534:65534 /opt/docker/monitoring/prometheus/*

# ls -l /opt/docker/monitoring/prometheus
合計 4
drwxr-xr-x 8 nobody nobody 4096 10月  4 08:19 data
drwxr-xr-x 3 nobody nobody   70 10月  3 15:39 etc
※所有ユーザ/グループの設定が誤っている場合、以下のエラーとなりコンテナの起動に失敗する。
# docker logs prometheus-2.37.1
(略)
ts=2022-10-04T07:51:22.656Z caller=query_logger.go:91 level=error component=activeQueryTracker msg="Error opening query log file" file=/prometheus/queries.active err="open /prometheus/queries.active: permission denied"
panic: Unable to create mmap-ed active query log
Prometheusコンテナの実行ユーザ/グループについてはドキュメントに記載がなかったので、以下のように確認した。 UID、GID共に65534だと分かる。
# docker run -it --rm --entrypoint sh prom/prometheus:v2.37.1
/prometheus $ id
uid=65534(nobody) gid=65534(nobody) groups=65534(nobody)
Grafanaコンテナのvolumes用ディレクトリも同様に作成し、所有ユーザ/グループを設定する。
# mkdir -p /opt/docker/monitoring/grafana/data

# chown 472:0 /opt/docker/monitoring/grafana/data

# ls -l /opt/docker/monitoring/grafana
合計 0
drwxr-xr-x 2 472 root 6 10月  4 07:51 data
※所有ユーザ/グループの設定が誤っている場合、以下のエラーとなりコンテナの起動に失敗する。
# docker logs grafana-oss-9.1.6
GF_PATHS_DATA='/var/lib/grafana' is not writable.
You may have issues with file permissions, more information here: http://docs.grafana.org/installation/docker/#migrate-to-v51-or-later
mkdir: can't create directory '/var/lib/grafana/plugins': Permission denied
Grafanaコンテナの実行ユーザ/グループについてはGrafanaドキュメントのここによると、UIDは472、GIDは0。
実際のコンテナでも念のため確認した。ドキュメント通り。
# docker run -it --rm --entrypoint sh grafana/grafana-oss:9.1.6
/usr/share/grafana $ id
uid=472(grafana) gid=0(root) groups=0(root)
Prometheusの設定ファイル(prometheus.yml)を作成する。
内容は公式ドキュメントの「GETTING STARTED」を参考にした。
# vim /opt/docker/monitoring/prometheus/prometheus.yml
global:
  scrape_interval: 15s # Prometheusがtargetからメトリクスを取得する間隔
  external_labels:
    monitor: 'codelab-monitor'

scrape_configs:
  # Prometheus
  - job_name: 'prometheus'
    scrape_interval: 5s # global.scrape_intervalを上書き
    static_configs:
      - targets: ['localhost:9090']
Prometheusコンテナ、Grafanaコンテナを起動する。
# docker compose -f /opt/docker/monitoring/docker-compose.yml -p monitoring up -d

# docker ps
CONTAINER ID   IMAGE                       COMMAND                  CREATED              STATUS              PORTS                                       NAMES
e70494ddaeb8   grafana/grafana-oss:9.1.6   "/run.sh"                About a minute ago   Up About a minute   0.0.0.0:3000->3000/tcp, :::3000->3000/tcp   grafana-oss-9.1.6
23583f1fe8ce   prom/prometheus:v2.37.1     "/bin/prometheus --c…"   About a minute ago   Up About a minute   0.0.0.0:9090->9090/tcp, :::9090->9090/tcp   prometheus-2.37.1
動作確認と初期設定
ブラウザで「http://{モニタリングサーバのIP}:9090」に接続し、Prometheusの画面が表示されることを確認する。

Prometheusが収集したメトリクスをグラフ化して参照してみる。
prometheus.ymlでPrometheus自身のメトリクス収集を設定してあるので、試しにPrometheusのローカルストレージのチャンクの 1 秒あたりのレートをグラフ化してみる。
Graphタブを選択して、「rate(prometheus_tsdb_head_chunks_created_total[1m])」と入力してexecuteをクリックすると、以下のようにグラフが表示される。

Prometheusが正常に動作していることが確認できたので、次にGrafanaでPrometheusが収集したメトリクスをグラフ化してみる。
ブラウザで「http://{モニタリングサーバのIP}:3000」に接続し、Grafanaのログイン画面が表示されることを確認する。

username、password共に「admin」と入力して「Log in」をクリックし、ログインできることを確認する。

Prometheusが収集したメトリクスにアクセスするには、Grafanaにデータソースとして追加する必要がある。
Grafanaで「Configuration(画面左の歯車マーク)」→「Data sources」→「Add data source」→「Prometheus」と選択する。

上記のように、設定値の入力画面になる。設定値の詳細は以下を参照のこと。 Prometheus data source | Grafana documentation
URLに「http://prometheus-2.37.1:9090」と入力し、画面下部の「Save & test」をクリックする。
以下のように、「Data source is working」と表示されれば、正常にデータソースに追加出来ている。

データソースに追加できたので、試しにグラフ化してみる。
「Dashboards(画面左の四角マーク)」→「+ New dashboard」→「Add a new panel」と進む。
画面下のMetrics browserに、先ほどPrometheusでグラフ表示した際と同様、「rate(prometheus_tsdb_head_chunks_created_total[1m])」と入力して「Run queris」をクリックする。
以下のようにグラフが表示される。

モニタリングサーバにて、Prometheusでメトリクス収集し、Grafanaでそれをグラフ化できることを確認できた。
次は管理対象のサーバからメトリクス収集する設定を行う。
Node Exporterでハードウェア・OSのメトリクスを収集する
以下を参考に、Node Exporterを使って管理対象サーバのハードウェア・OSメトリクスを収集してみる。
prometheus.io
GitHub - prometheus/node_exporter: Exporter for machine metrics
Node Exporterのインストール・起動
管理対象サーバにtarballでNode Exporterをインストールする。
tarballはここからダウンロードできる。
# mkdir /opt/prometheus

# cd /opt/prometheus

# wget https://github.com/prometheus/node_exporter/releases/download/v1.4.0/node_exporter-1.4.0.linux-amd64.tar.gz

# tar zxf node_exporter-1.4.0.linux-amd64.tar.gz

# ls -l node_exporter-1.4.0.linux-amd64
合計 19200
-rw-r--r--. 1 3434 3434    11357  9月 26 12:39 LICENSE
-rw-r--r--. 1 3434 3434      463  9月 26 12:39 NOTICE
-rwxr-xr-x. 1 3434 3434 19640886  9月 26 12:33 node_exporter

# ln -s /opt/prometheus/node_exporter-1.4.0.linux-amd64/node_exporter /usr/local/bin/node_exporter

# ls -l /usr/local/bin/node_exporter
lrwxrwxrwx. 1 root root 61 10月 11 07:08 /usr/local/bin/node_exporter -> /opt/prometheus/node_exporter-1.4.0.linux-amd64/node_exporter

# rm -rf node_exporter-1.4.0.linux-amd64.tar.gz
Node Exporterを起動する。
# nohup node_exporter &

# ps aux | grep node_exporter | grep -v grep
root       14381  0.0  1.2 724844 22596 pts/0    Sl   11:53   0:00 ./node_exporter
以下のように、Node Exporterが公開しているメトリクスを「http://localhost:9100/metrics」で確認できる。
# curl -s http://localhost:9100/metrics  | head
# HELP go_gc_duration_seconds A summary of the pause duration of garbage collection cycles.
# TYPE go_gc_duration_seconds summary
go_gc_duration_seconds{quantile="0"} 3.1201e-05
go_gc_duration_seconds{quantile="0.25"} 6.0298e-05
go_gc_duration_seconds{quantile="0.5"} 8.5714e-05
go_gc_duration_seconds{quantile="0.75"} 0.000121806
go_gc_duration_seconds{quantile="1"} 0.003530947
go_gc_duration_seconds_sum 2.909751902
go_gc_duration_seconds_count 10781
# HELP go_goroutines Number of goroutines that currently exist.
Prometheusの設定変更
Node Exporterからメトリクスを収集するよう、Prometheusに設定をする。
モニタリングサーバのprometheus.ymlに以下のように追記をする。
# vim /opt/docker/monitoring/prometheus/etc/prometheus.yml
global:
  scrape_interval: 15s # Prometheusがtargetからメトリクスを取得する間隔
  external_labels:
    monitor: 'codelab-monitor'

scrape_configs:
  # Prometheus
  - job_name: 'prometheus'
    scrape_interval: 5s # global.scrape_intervalを上書き
    static_configs:
      - targets: ['localhost:9090']
  # Node Exporter
  - job_name: node
    file_sd_configs:
      - refresh_interval: 30s # targetsファイルの読み込み間隔
        files:                # targetsファイルを記載
        - /etc/prometheus/sd_files/node_targets.yml

# vim /opt/docker/monitoring/prometheus/etc/sd_files/node_targets.yml
- targets:
→メトリクス収集対象は、「job_name: 'prometheus'」に設定しているように「static_configs」に固定的に記載すると、設定変更時にPrometheusの再起動orリロードが必要になる。
Prometheusには他にファイルベースのServiceDiscovery機能がある。
「file_sd_configs」に設定したtargetsファイルに収集対象を記載することで、定期的(デフォルトは5分間隔)にファイルが読み込まれ、記載内容が自動反映される挙動となるため、これを使ってみる。
ちなみに、今回は設定変更がすぐ反映されるよう、refresh_intervalを設定することで読み込み間隔を30秒に短縮している。
※targetsファイルの書式や、refresh_intervalについてはこちらを参照。
Prometheusをリロードして、prometheus.ymlの変更を反映する。
(リロード方法はこれを参考にした。)
# docker exec -it prometheus-2.37.1 killall -HUP prometheus

# docker logs prometheus-2.37.1
(略)
ts=2022-10-01T12:38:36.093Z caller=main.go:1177 level=info msg="Loading configuration file" filename=/etc/prometheus/prometheus.yml
ts=2022-10-01T12:38:36.093Z caller=main.go:1214 level=info msg="Completed loading of configuration file" filename=/etc/prometheus/prometheus.yml totalDuration=490.179μs db_storage=1.123μs remote_storage=1.402μs web_handler=592ns query_engine=1.256μs scrape=81.433μs scrape_sd=40.833μs notify=1.098μs notify_sd=1.645μs rules=1.487μs tracing=3.89μs
PrometheusのWeb画面で「Status」→「Targets」と選択すると、以下のように収集対象を確認できる。
node_targets.ymlに収集対象の情報を記載していないため、Node Exporterはまだ収集対象になっていない。

targetsファイルを編集する。JSON、YAMLで記載できるが今回はYAMLで記載した。
# vim /opt/docker/monitoring/prometheus/etc/sd_files/node_targets.yml
- targets:
    - {管理対象サーバのIP}:9100
  labels:
    service: node # Node Exporterだと分かるように、Labelを付けておく。
編集後30秒以内には、ファイルベースのServiceDiscovery機能により管理対象サーバのNode ExporterがPrometheusのTargetsに追加される。

Grafanaのダッシュボードを作成
Grafanaでダッシュボードを作成するが、一から作成するのは手間がかかる。
Grafanaにはダッシュボードをインポートする機能があるので、インポートして作成する。
ダッシュボードは、以下サイトで公開されている。
インポートしたいダッシュボードのIDを控えておく。
grafana.com
今回は「Node Exporter Full」というダッシュボードを使わせていただく。
GrafanaのWeb画面で「Dashboards(画面左の四角マーク)」→「+ Import」と進み、「Import via grafana.com」に控えていたダッシュボードのIDを入力し、「Load」をクリックする。
以下のようにダッシュボードの情報が表示されるので、「Prometheus」にDataSourceに追加したPrometheusを選択し、「Import」をクリックする。

以下のように、インポートしたダッシュボードが表示される。
あとは必要に応じてカスタマイズしていけばOK。

Node Exporterの自動起動設定
Node Exporterをtarballでインストールした場合、そのままだと自動起動設定できないので、systemd service化する必要がある。
以下を参考にやってみる。
node_exporter/examples/systemd at master · prometheus/node_exporter · GitHub
Installing node_exporter as systemd serivice · GitHub
Node Exporter用のユーザを作成し、必要な権限設定・ディレクトリ作成を行う。
Node Exporter実行用のユーザを作成
# useradd --system --shell /sbin/nologin node_exporter

ユーザが作成されたことを確認
# cat /etc/group | grep node_exporter
node_exporter:x:985:

Node Exporterの実行ファイルの権限を変更
# chown node_exporter:node_exporter /usr/local/bin/node_exporter

リンク先を確認(シンボリックリンク自体のパーミッションに意味はないので気にしなくてよい。)
# ls -l /usr/local/bin/node_exporter
lrwxrwxrwx. 1 root root 61 10月 11 07:08 /usr/local/bin/node_exporter -> /opt/prometheus/node_exporter-1.4.0.linux-amd64/node_exporter

Node Exporterの実行ファイルの権限を確認
# ls -l /opt/prometheus/node_exporter-1.4.0.linux-amd64/node_exporter
-rwxr-xr-x. 1 node_exporter node_exporter 19640886  9月 26 12:33 /opt/prometheus/node_exporter-1.4.0.linux-amd64/node_exporter

Node ExporterのTEXTFILE COLLECTOR用ディレクトリを作成
# mkdir -p /var/lib/node_exporter/textfile_collector

TEXTFILE COLLECTOR用ディレクトリの権限設定
# chown node_exporter:node_exporter /var/lib/node_exporter/textfile_collector

TEXTFILE COLLECTOR用ディレクトリの権限確認
# ll /var/lib/node_exporter
合計 0
drwxr-xr-x. 2 node_exporter node_exporter 6 10月  2 14:54 textfile_collector
serviceの定義ファイルを作成する。
# cat <<EOF > /etc/systemd/system/node_exporter.service
[Unit]
Description=Node Exporter

[Service]
User=node_exporter
EnvironmentFile=-/etc/sysconfig/node_exporter
ExecStart=/usr/local/bin/node_exporter \$OPTIONS

[Install]
WantedBy=multi-user.target
EOF

# echo "OPTIONS=\"--collector.textfile.directory /var/lib/node_exporter/textfile_collector\"" > /etc/sysconfig/node_exporter
serviceとして登録する。
# systemctl daemon-reload

# systemctl enable --now node_exporter
Created symlink /etc/systemd/system/multi-user.target.wants/node_exporter.service → /etc/systemd/system/node_exporter.service.
node_exporterが正常に起動していることを確認する。「Active: active (running)」となっていればOK。
これで、サーバを再起動しても自動的にnode_exporterが起動する。
# systemctl status node_exporter
● node_exporter.service - Node Exporter
   Loaded: loaded (/etc/systemd/system/node_exporter.service; enabled; vendor preset: disabled)
   Active: active (running) since Tue 2022-10-11 07:18:07 UTC; 33s ago
 Main PID: 421117 (node_exporter)
    Tasks: 5 (limit: 10992)
   Memory: 8.0M
   CGroup: /system.slice/node_exporter.service
           mq421117 /usr/local/bin/node_exporter --collector.textfile.directory /var/lib/node_exporter/textfile_collector

10月 11 07:18:07 ip-10-0-102-254.ap-northeast-1.compute.internalmydomain.local node_exporter[421117]: ts=2022-10-11T07:18:07.479Z caller=node_exporter.go:115 level=info collector=thermal_zone
10月 11 07:18:07 ip-10-0-102-254.ap-northeast-1.compute.internalmydomain.local node_exporter[421117]: ts=2022-10-11T07:18:07.479Z caller=node_exporter.go:115 level=info collector=time
10月 11 07:18:07 ip-10-0-102-254.ap-northeast-1.compute.internalmydomain.local node_exporter[421117]: ts=2022-10-11T07:18:07.479Z caller=node_exporter.go:115 level=info collector=timex
10月 11 07:18:07 ip-10-0-102-254.ap-northeast-1.compute.internalmydomain.local node_exporter[421117]: ts=2022-10-11T07:18:07.479Z caller=node_exporter.go:115 level=info collector=udp_queues
10月 11 07:18:07 ip-10-0-102-254.ap-northeast-1.compute.internalmydomain.local node_exporter[421117]: ts=2022-10-11T07:18:07.479Z caller=node_exporter.go:115 level=info collector=uname
10月 11 07:18:07 ip-10-0-102-254.ap-northeast-1.compute.internalmydomain.local node_exporter[421117]: ts=2022-10-11T07:18:07.479Z caller=node_exporter.go:115 level=info collector=vmstat
10月 11 07:18:07 ip-10-0-102-254.ap-northeast-1.compute.internalmydomain.local node_exporter[421117]: ts=2022-10-11T07:18:07.479Z caller=node_exporter.go:115 level=info collector=xfs
10月 11 07:18:07 ip-10-0-102-254.ap-northeast-1.compute.internalmydomain.local node_exporter[421117]: ts=2022-10-11T07:18:07.479Z caller=node_exporter.go:115 level=info collector=zfs
10月 11 07:18:07 ip-10-0-102-254.ap-northeast-1.compute.internalmydomain.local node_exporter[421117]: ts=2022-10-11T07:18:07.479Z caller=node_exporter.go:199 level=info msg="Listening on" address=:9100
10月 11 07:18:07 ip-10-0-102-254.ap-northeast-1.compute.internalmydomain.local node_exporter[421117]: ts=2022-10-11T07:18:07.479Z caller=tls_config.go:195 level=info msg="TLS is disabled." http2=false
Node Exporterの収集対象を制御する
Node Exporterの収集対象は、以下のオプションで制御できる。
「<name>」に指定する文字列はこちらの表で確認できる。
- デフォルトで無効な収集対象を有効にする:--collector.<name>
- デフォルトで有効な収集対象を無効にする:--no-collector.<name>
- 特定の収集対象のみ有効にする:--collector.disable-defaults --collector.<name>
実際に設定変更して確認してみる。
デフォルトで収集されているメトリクスの数を確認。
# curl -s http://localhost:9100/metrics | grep -v "#" | wc -l
568
デフォルトで有効な収集対象を全て無効にすると、メトリクス数は減っているが0にはならなかった。
無効化できない最低限のメトリクスがある模様。
# vim /etc/sysconfig/node_exporter
OPTIONS="--collector.textfile.directory /var/lib/node_exporter/textfile_collector --collector.disable-defaults"

# systemctl restart node_exporter

# curl -s http://localhost:9100/metrics | grep -v "#" | wc -l
47

# curl -s http://localhost:9100/metrics | grep -v "#" | cut -f 1 -d " " > /tmp/disable-defaults.txt
cpuとmeminfoだけ有効化してみると、メトリクス数がやや増えた。
# vim /etc/sysconfig/node_exporter
OPTIONS="--collector.textfile.directory /var/lib/node_exporter/textfile_collector --collector.disable-defaults --collector.cpu --collector.meminfo"

# systemctl restart node_exporter

# curl -s http://localhost:9100/metrics | grep -v "#" | wc -l
122
メトリクス項目の差分を見ると、CPU、メモリのメトリクスが増えていることが分かる。
# diff /tmp/disable-defaults.txt /tmp/cpu_meminfo.txt
(略)
> node_cpu_guest_seconds_total{cpu="0",mode="nice"}
> node_cpu_guest_seconds_total{cpu="0",mode="user"}
(略)
> node_memory_WritebackTmp_bytes
> node_memory_Writeback_bytes
> node_scrape_collector_duration_seconds{collector="cpu"}
> node_scrape_collector_duration_seconds{collector="meminfo"}
> node_scrape_collector_success{collector="cpu"}
> node_scrape_collector_success{collector="meminfo"}
cAdvisorでDockerコンテナのメトリクスを収集する
以下を参考に、cAdvisorを使って管理対象サーバのコンテナのメトリクスを収集してみる。
Monitoring Docker container metrics using cAdvisor | Prometheus
cAdvisorの起動
管理対象サーバでcAdvisorコンテナを起動する。
Advisorコンテナは、サーバ再起動後も自動起動してほしいので、上記リンクの起動コマンドに「--restart=always」を追加した。
# VERSION=v0.45.0
# docker run \
  --volume=/:/rootfs:ro \
  --volume=/var/run:/var/run:ro \
  --volume=/sys:/sys:ro \
  --volume=/var/lib/docker/:/var/lib/docker:ro \
  --volume=/dev/disk/:/dev/disk:ro \
  --publish=8080:8080 \
  --detach=true \
  --name=cadvisor \
  --privileged \
  --device=/dev/kmsg \
  --restart=always \
  gcr.io/cadvisor/cadvisor:$VERSION

# docker ps
CONTAINER ID   IMAGE                              COMMAND                  CREATED         STATUS                            PORTS                                       NAMES
f36db3b97eee   gcr.io/cadvisor/cadvisor:v0.45.0   "/usr/bin/cadvisor -…"   5 seconds ago   Up 4 seconds (health: starting)   0.0.0.0:8080->8080/tcp, :::8080->8080/tcp   cadvisor
ブラウザで「http://{管理対象サーバのIP}:8080/」に接続すると、cAdvisorのWeb画面を参照できる。

また、cAdvisorが公開しているメトリクスを「http://localhost:8080/metrics」で確認できる。
# curl -s http://localhost:9100/metrics  | head
# HELP go_gc_duration_seconds A summary of the pause duration of garbage collection cycles.
# TYPE go_gc_duration_seconds summary
go_gc_duration_seconds{quantile="0"} 3.1201e-05
go_gc_duration_seconds{quantile="0.25"} 6.0298e-05
go_gc_duration_seconds{quantile="0.5"} 8.5714e-05
go_gc_duration_seconds{quantile="0.75"} 0.000121806
go_gc_duration_seconds{quantile="1"} 0.003530947
go_gc_duration_seconds_sum 2.909751902
go_gc_duration_seconds_count 10781
# HELP go_goroutines Number of goroutines that currently exist.
各メトリクスの説明は以下を参照。
cadvisor/prometheus.md at master · google/cadvisor · GitHub
※ちなみに、以下のようにcAdvisorの実行オプションに--enable_metricsを追加することで、デフォルトで有効になっていない収集メトリクスを有効化できる(無効にしたい場合は--disable_metrics)。
--enable_metricsに指定する文字列は、上記メトリクス説明ページの表を参照。カンマ区切りで複数指定できる。
# VERSION=v0.45.0
# docker run \
  --volume=/:/rootfs:ro \
  --volume=/var/run:/var/run:ro \
  --volume=/sys:/sys:ro \
  --volume=/var/lib/docker/:/var/lib/docker:ro \
  --volume=/dev/disk/:/dev/disk:ro \
  --publish=8080:8080 \
  --detach=true \
  --name=cadvisor \
  --privileged \
  --device=/dev/kmsg \
  --restart=always \
  gcr.io/cadvisor/cadvisor:$VERSION \
  --enable_metrics=cpu_topology,memory
確認用コンテナの起動
確認用に、Redisコンテナを起動する。
# docker run --publish=6379:6379 --detach=true --name=redis redis:latest

# docker ps
CONTAINER ID   IMAGE                              COMMAND                  CREATED         STATUS                   PORTS                                       NAMES
8b5881b568b2   redis:latest                       "docker-entrypoint.s…"   2 seconds ago   Up 1 second              0.0.0.0:6379->6379/tcp, :::6379->6379/tcp   redis
f36db3b97eee   gcr.io/cadvisor/cadvisor:v0.45.0   "/usr/bin/cadvisor -…"   7 minutes ago   Up 7 minutes (healthy)   0.0.0.0:8080->8080/tcp, :::8080->8080/tcp   cadvisor
cAdvisorはサーバ内に存在しているコンテナ単位にメトリクスを収集する。
ブラウザで「http://{管理対象サーバのIP}:8080/docker/redis」に接続すると、redisコンテナのメトリクスが見られる。

Prometheusの設定変更
cAdvisorからメトリクスを収集するよう、Prometheusに設定をする。
モニタリングサーバのprometheus.ymlに以下のように追記をする。
# vim /opt/docker/monitoring/prometheus/etc/prometheus.yml
global:
  scrape_interval: 15s # Prometheusがtargetからメトリクスを取得する間隔
  external_labels:
    monitor: 'codelab-monitor'

scrape_configs:
  # Prometheus
  - job_name: 'prometheus'
    scrape_interval: 5s # global.scrape_intervalを上書き
    static_configs:
      - targets: ['localhost:9090']
  # Node Exporter
  - job_name: node
    file_sd_configs:
      - refresh_interval: 30s # targetsファイルの読み込み間隔
        files:                # targetsファイルを記載
        - /etc/prometheus/sd_files/node_targets.yml
  # cAdvisor
  - job_name: cadvisor
    scrape_interval: 5s
    file_sd_configs:
      - refresh_interval: 30s # targetsファイルの読み込み間隔
        files:                # targetsファイルを記載
        - /etc/prometheus/sd_files/cadvisor_targets.yml

# vim /opt/docker/monitoring/prometheus/etc/sd_files/cadvisor_targets.yml
- targets:
    - {管理対象サーバのIP}:8080
  labels:
    service: cadvisor
Prometheusをリロードして、prometheus.ymlの変更を反映する。
# docker exec -it prometheus-2.37.1 killall -HUP prometheus
少し待ってからPrometheusのWeb画面で「Status」→「Targets」を確認すると、以下のようにcAdvisorが追加されている。

Grafanaのダッシュボードを作成
Node Exporter同様、インポートしてダッシュボードを作成する。 「Docker Container」というダッシュボードを使わせていただく。
インポートすると、以下のようにコンテナのメトリクスが表示される。

補足:cAdvisorの警告メッセージ
cAdvisorコンテナから、「There are no NVM devices!」というメッセージが出力され続けていることに気付いた。
# docker logs cadvisor
I1005 07:08:45.103690       1 manager.go:1191] Exiting thread watching subcontainers
I1005 07:08:45.103714       1 manager.go:405] Exiting global housekeeping thread
I1005 07:08:45.104268       1 cadvisor.go:210] Exiting given signal: terminated
W1005 07:10:20.790347       1 machine_libipmctl.go:64] There are no NVM devices!
W1005 07:15:20.942362       1 machine_libipmctl.go:64] There are no NVM devices!
→Warningだし、特に問題無く動作しているように思える。できれば消したいが、消す方法が見つからなかった。
NVMデバイスがないサーバでは出力させ続けるしかないのかもしれない。
まとめ
- Docker ComposeでPrometheusとGrafanaを起動することで、簡単にモニタリング環境を構築できた。
- Node ExporterとcAdvisorを使用することで、ハードウェア・OS・コンテナのメトリクスを収集出来ることを確認した。
- 今後は以下も試してみたい。
- Promeheusuのリモートストレージの利用
- Node Exporterで独自メトリクスを収集 →やってみた。記事はこちら。
- Prometheusの他のServiceDiscovery方法を試す
- Prometheusのリラベル機能を試す
- ログ収集も統合出来ないか試す
NetdataをRockyLinux8にインストールする
Netdataというサーバのメトリクスを取得・可視化するOSSをRockyLinux8にインストールした時のメモ。
環境
・OS:Rocky Linux 8.6
・Netdata:v1.36.1
実施内容
インストール手順は以下に記載されている。
learn.netdata.cloud
デフォルトの挙動だと、リポジトリを追加して、dnfでNetdataのパッケージがインストールされる。
この際に依存関係にあるパッケージ(Python3.8など)も一緒にインストールされるが、これが不都合な場合がある。
依存ライブラリが含まれた静的バイナリを配置する方法であれば余計なパッケージがインストールされないので、今回はその方法でインストールする。
インストールは以下のように実施した。
インストールスクリプト実行時に付けているオプションの意味は以下。
--no-updates:Netdataの自動更新を無効にする
--install-version {バージョン番号}:インストールするNetdataのバージョンを指定する(安定最新版をインストールしたい場合は「--stable-channel」に変える)
--disable-telemetry:統計送信をさせない
--non-interactive:インストール中にyes/noを聞かれなくなる(全てyesと答えたことになる)
--static-only:静的バイナリを配置する方法でインストールを行う
インストールスクリプトを実行
# wget -O /tmp/netdata-kickstart.sh https://my-netdata.io/kickstart.sh && sh /tmp/netd
ata-kickstart.sh --no-updates --install-version 1.36.1--disable-telemetry --static-only --non-interactive

netdataが正常に起動していることを確認
# systemctl status netdata
● netdata.service - Real time performance monitoring
   Loaded: loaded (/usr/lib/systemd/system/netdata.service; enabled; vendor preset: disabled)
   Active: active (running) since Sat 2022-10-01 13:56:34 UTC; 1min 27s ago
  Process: 1805 ExecStartPre=/bin/chown -R netdata:netdata /opt/netdata/var/run/netdata (code=exited, status=0/SUCCESS)
  Process: 1802 ExecStartPre=/bin/mkdir -p /opt/netdata/var/run/netdata (code=exited, status=0/SUCCESS)
  Process: 1800 ExecStartPre=/bin/chown -R netdata:netdata /opt/netdata/var/cache/netdata (code=exited, status=0/SUCCESS)
  Process: 1799 ExecStartPre=/bin/mkdir -p /opt/netdata/var/cache/netdata (code=exited, status=0/SUCCESS)
 Main PID: 1807 (netdata)
    Tasks: 58 (limit: 10992)
   Memory: 125.8M
   CGroup: /system.slice/netdata.service
           tq1807 /opt/netdata/bin/srv/netdata -P /opt/netdata/var/run/netdata/netdata.pid -D
           tq1810 /opt/netdata/bin/srv/netdata --special-spawn-server
           tq1945 /opt/netdata/usr/libexec/netdata/plugins.d/apps.plugin 1
           tq1975 /opt/netdata/usr/libexec/netdata/plugins.d/ebpf.plugin 1
           mq1978 /opt/netdata/usr/libexec/netdata/plugins.d/go.d.plugin 1
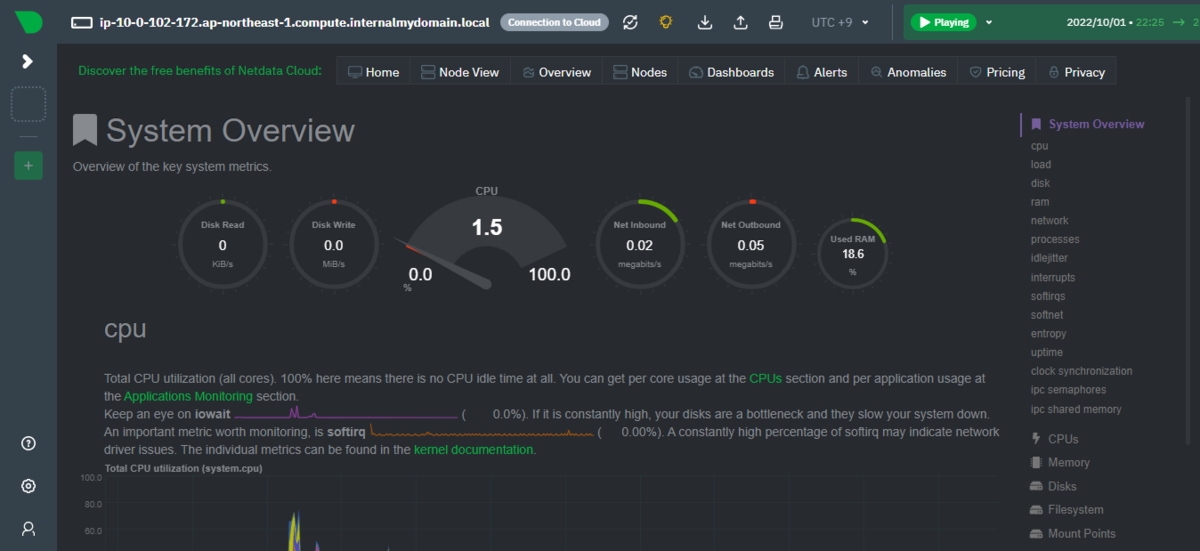
ブラウザで「http://{インストールしたサーバのIP}:19999」に接続すると、以下のようにNetdataの画面が表示される。
内容を見ると、様々なメトリクスのリアルタイムの情報が可視化されていることが分かる。